The Equation of Time may be displayed on or near a Sundial (or anywhere else) in a number of ways... For historical information - refer to The Equation of Time as shown on Sundials by John Davis BSS Bulletin Dec 2003 - which can be found at the bottom of this page.
... AS A TABLE
The table may have : Every day of the Year : Occasional Days : Every Day that the EoT changes by a minute or half minute
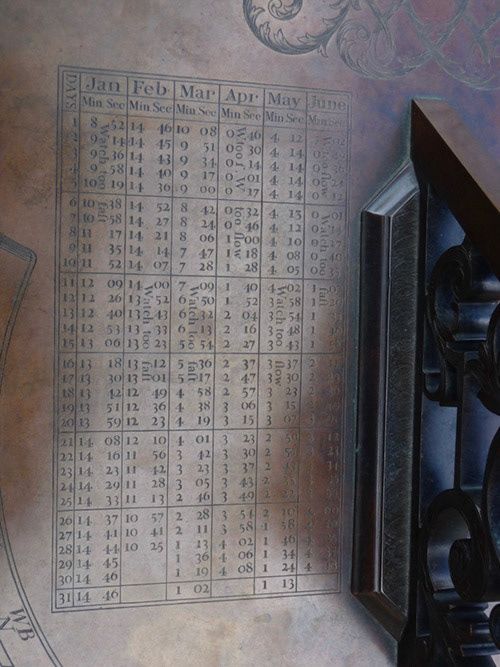
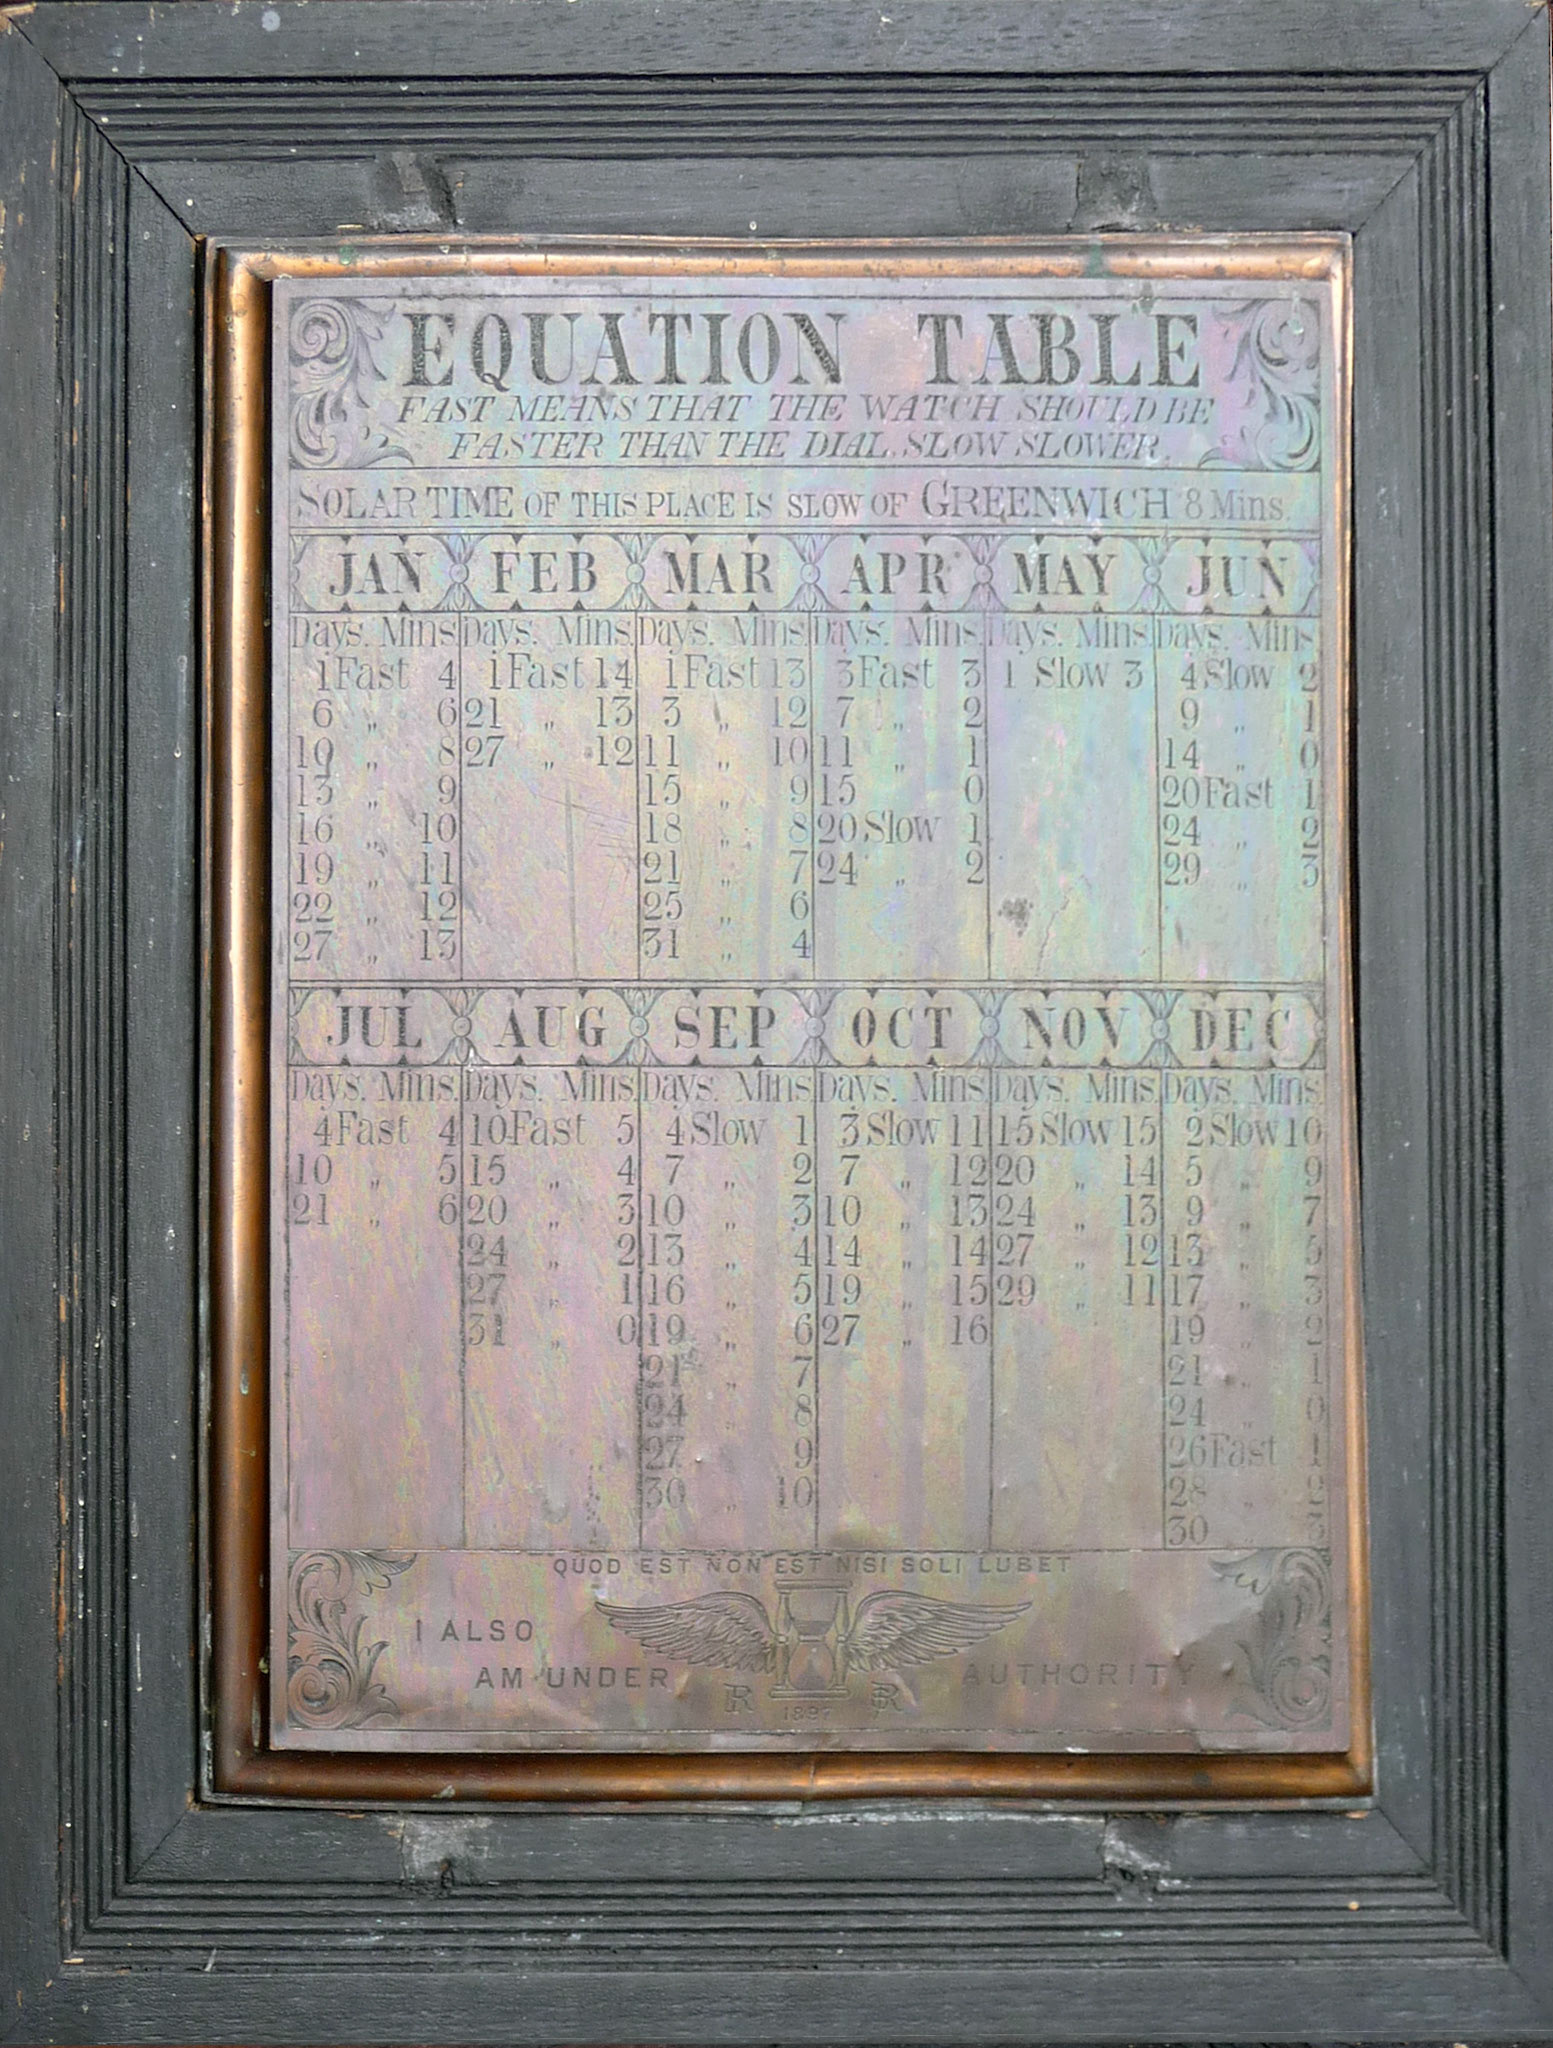
Full Year Table from Tompion's Dial at Hampton Court Palace. This is a replica dial - the original is in the museum.
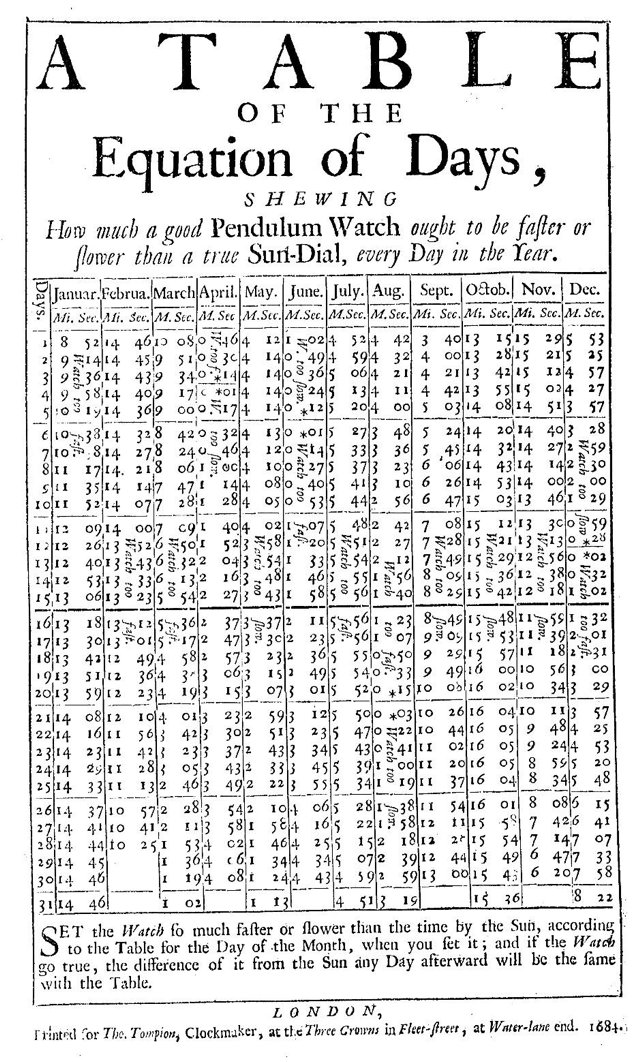
The clockmaker, Thomas Tompion's Equation table of 1683. Some 12 years later, the first Astronomer Royal, John Flamsteed, wrote to Sir Isaac Newton "Tompion's a true table of equations, but made for a particular year perhaps, fits not the present" !
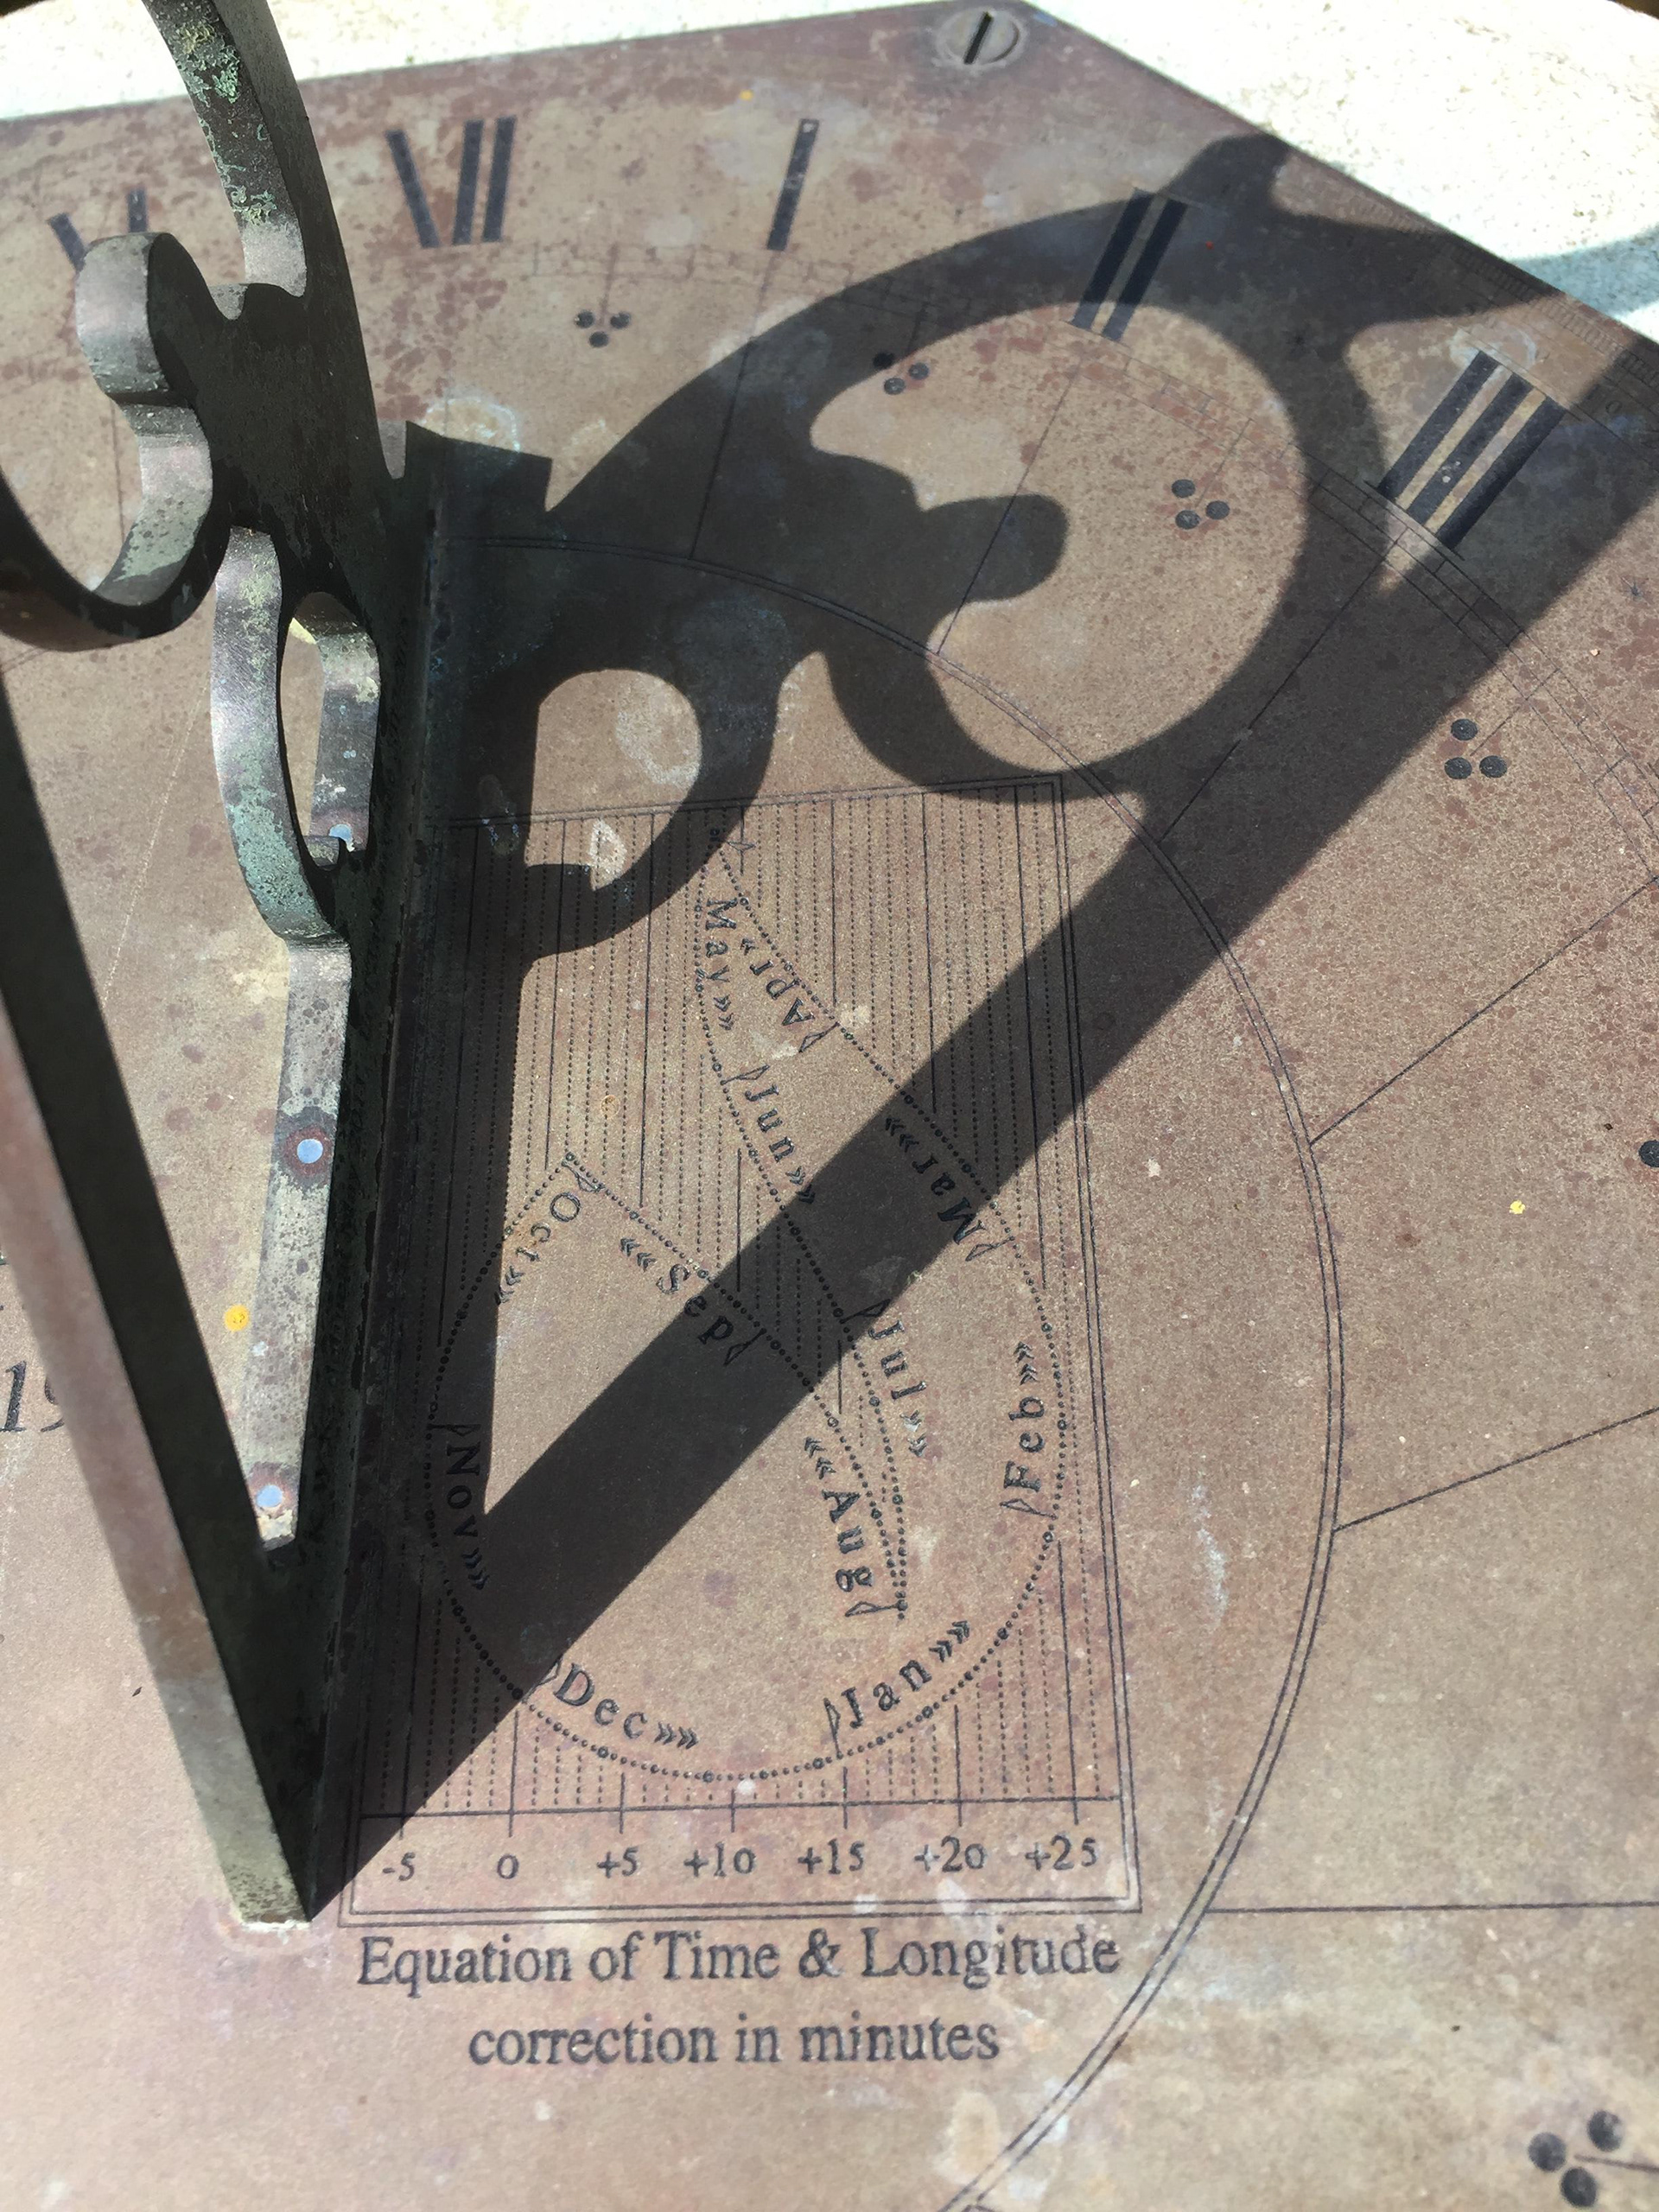
Partial Table on a Dial from Wheelbirks Farm in Northumberland, UK
Partial Table from Gillamore, Yorkshire, UK
Minute Table from Wheelbirks
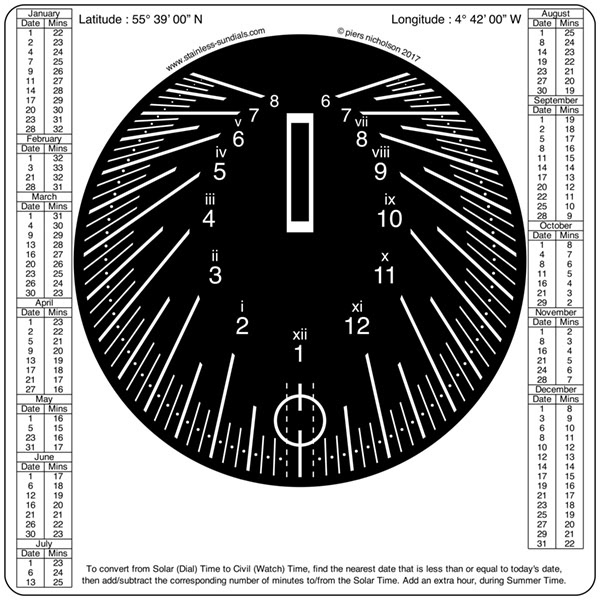
Minute Table on Spot-On dial, delineated by the Author
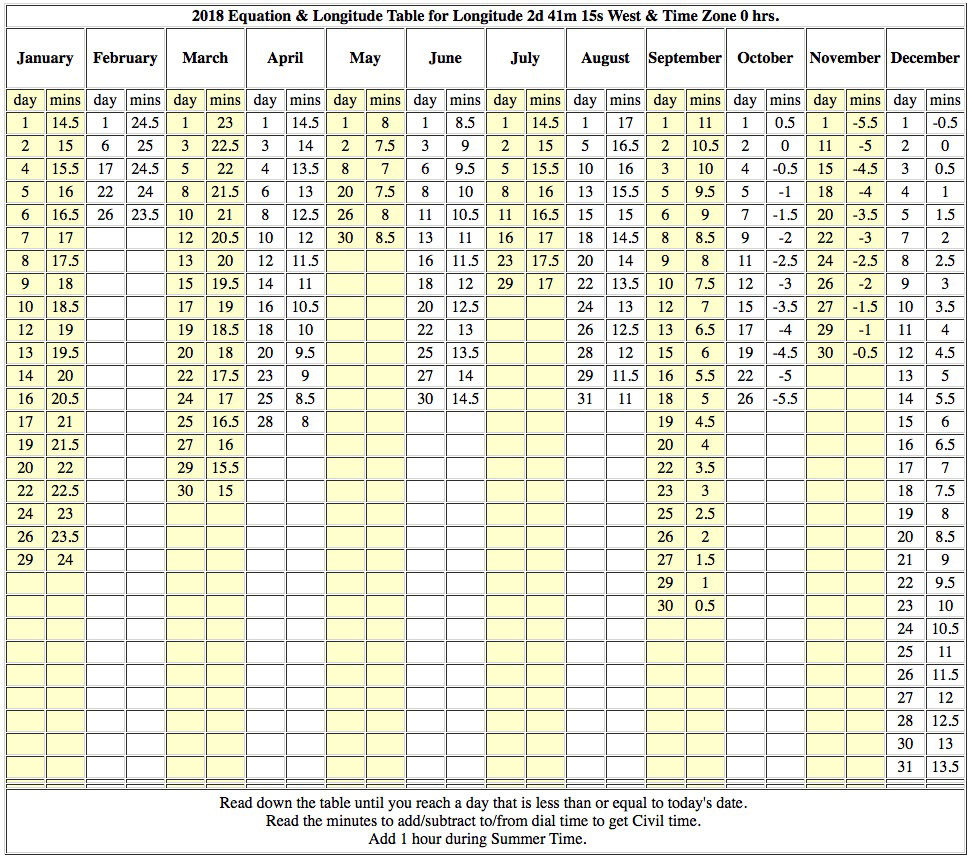
Half Minute Table from the Author.
Click on images to enlarge & view captions
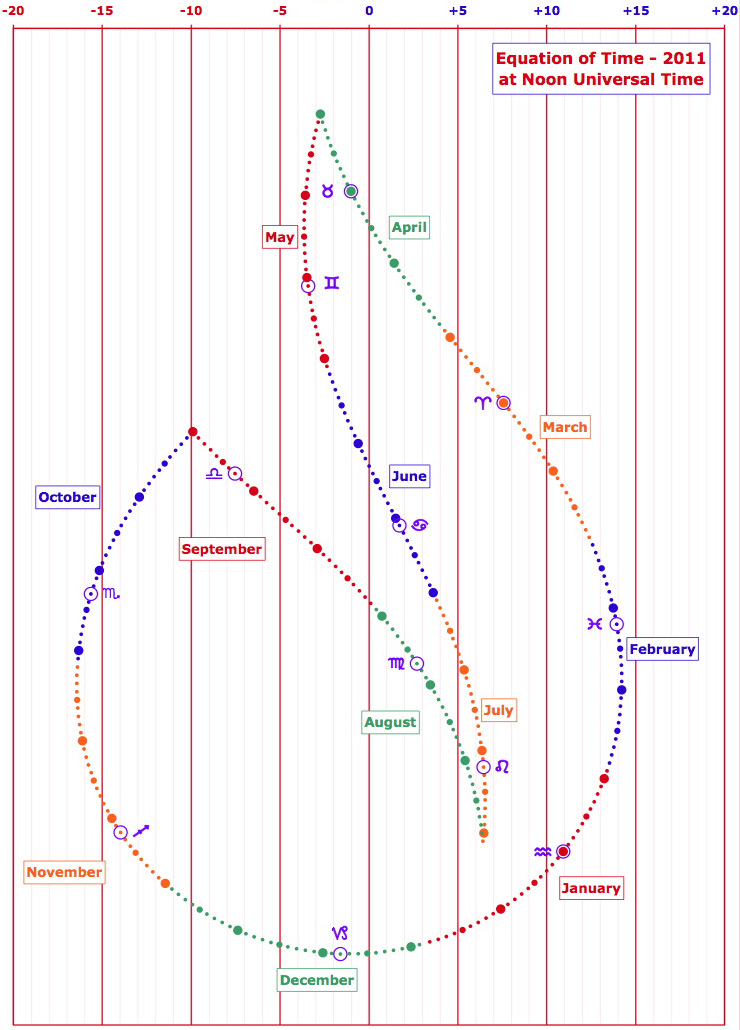
... AS A GRAPH
The Graph may be Rectilinear, Polar or Intrinsic
Intrinsic Graphs (in the cases illustrated) are explained below.
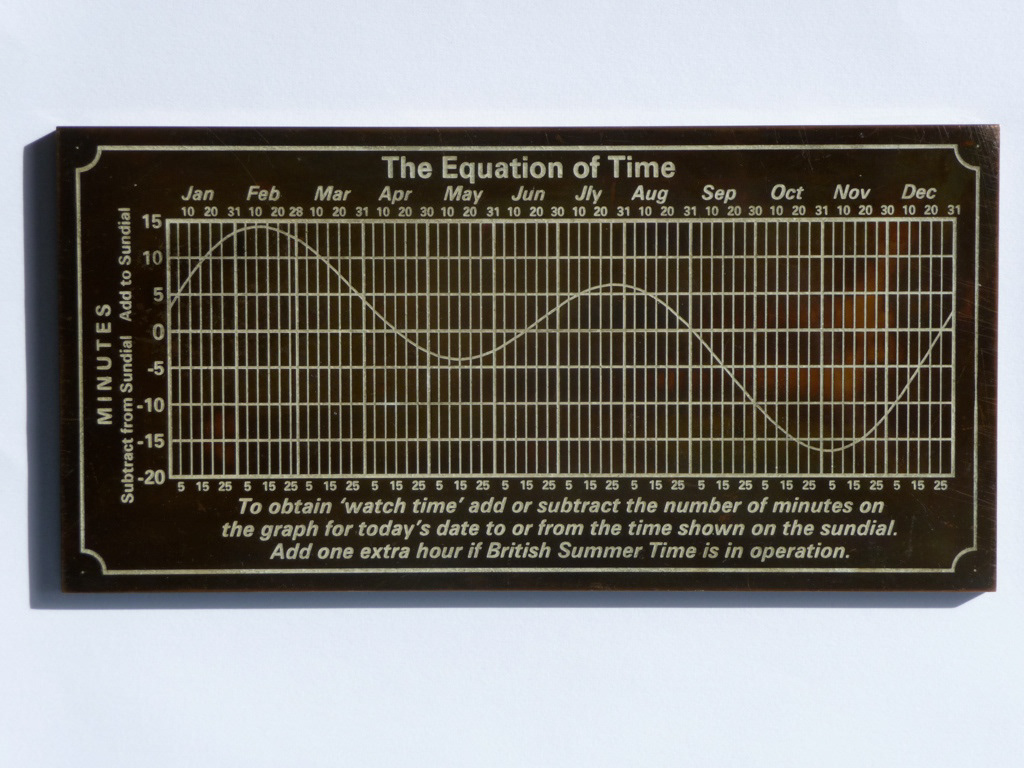
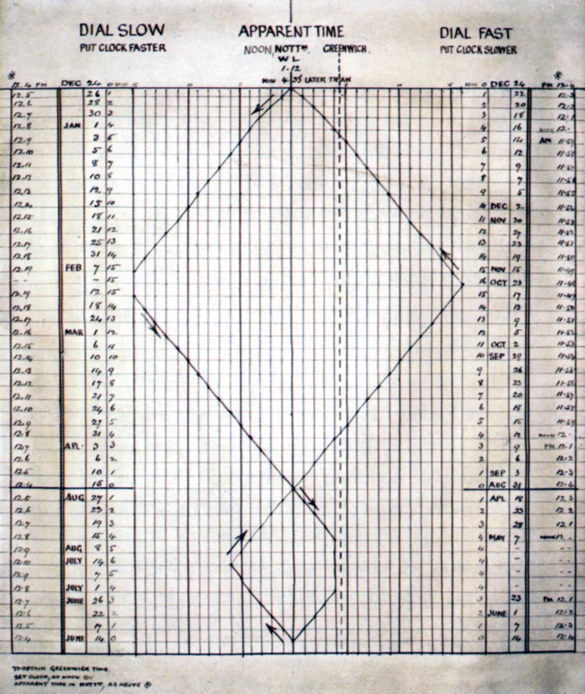
'Normal' Rectilinear Graph by Tony Moss
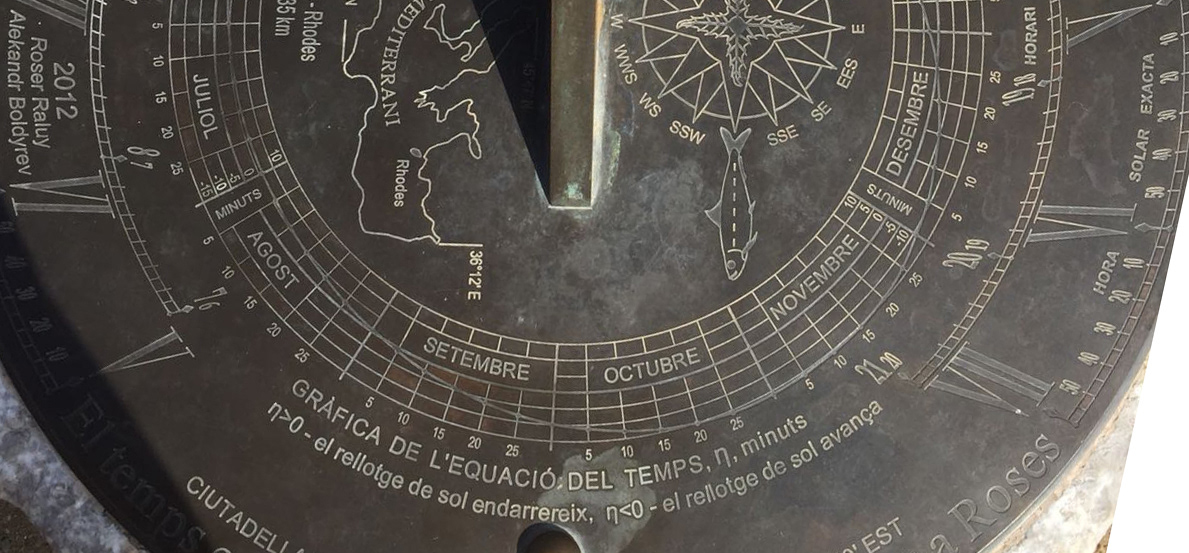
Roser Raluy & Alexandr Boldyrev http://sundials.ru/en/ - 2012 - Roses, Catalonia
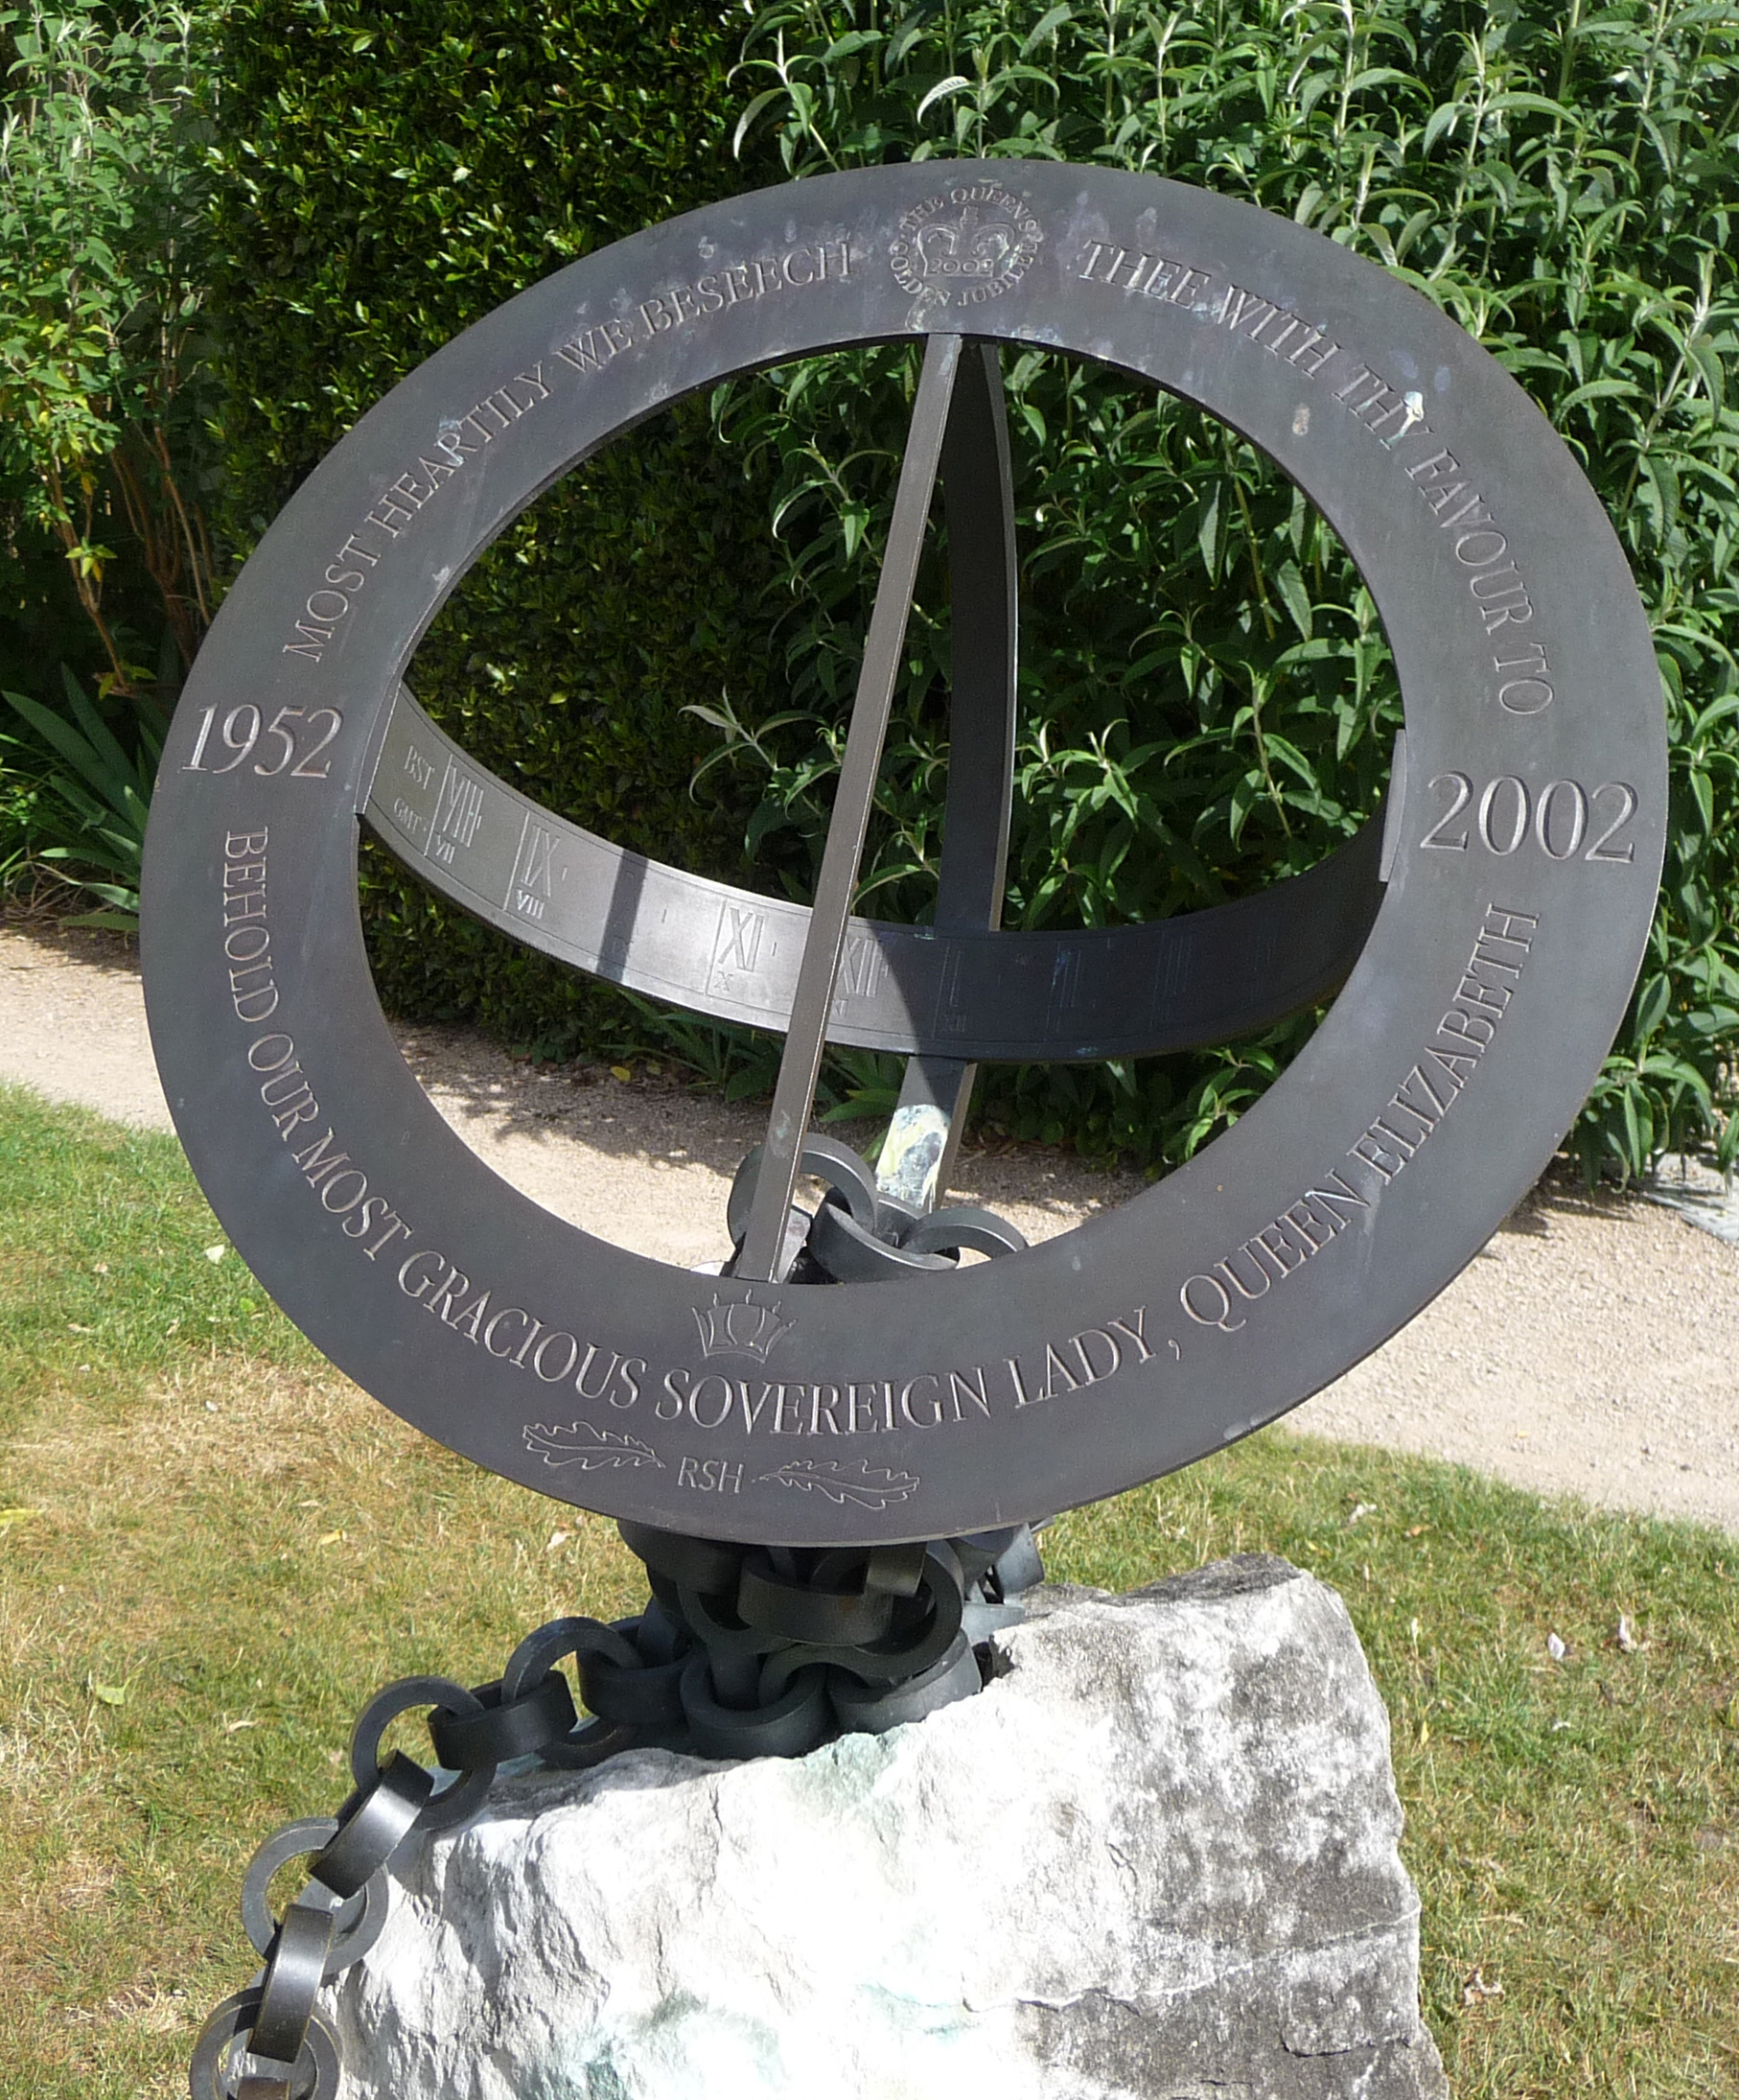
Joanna Migdal - 2002 - Haslemere Museum: graph on back of equatorial ring
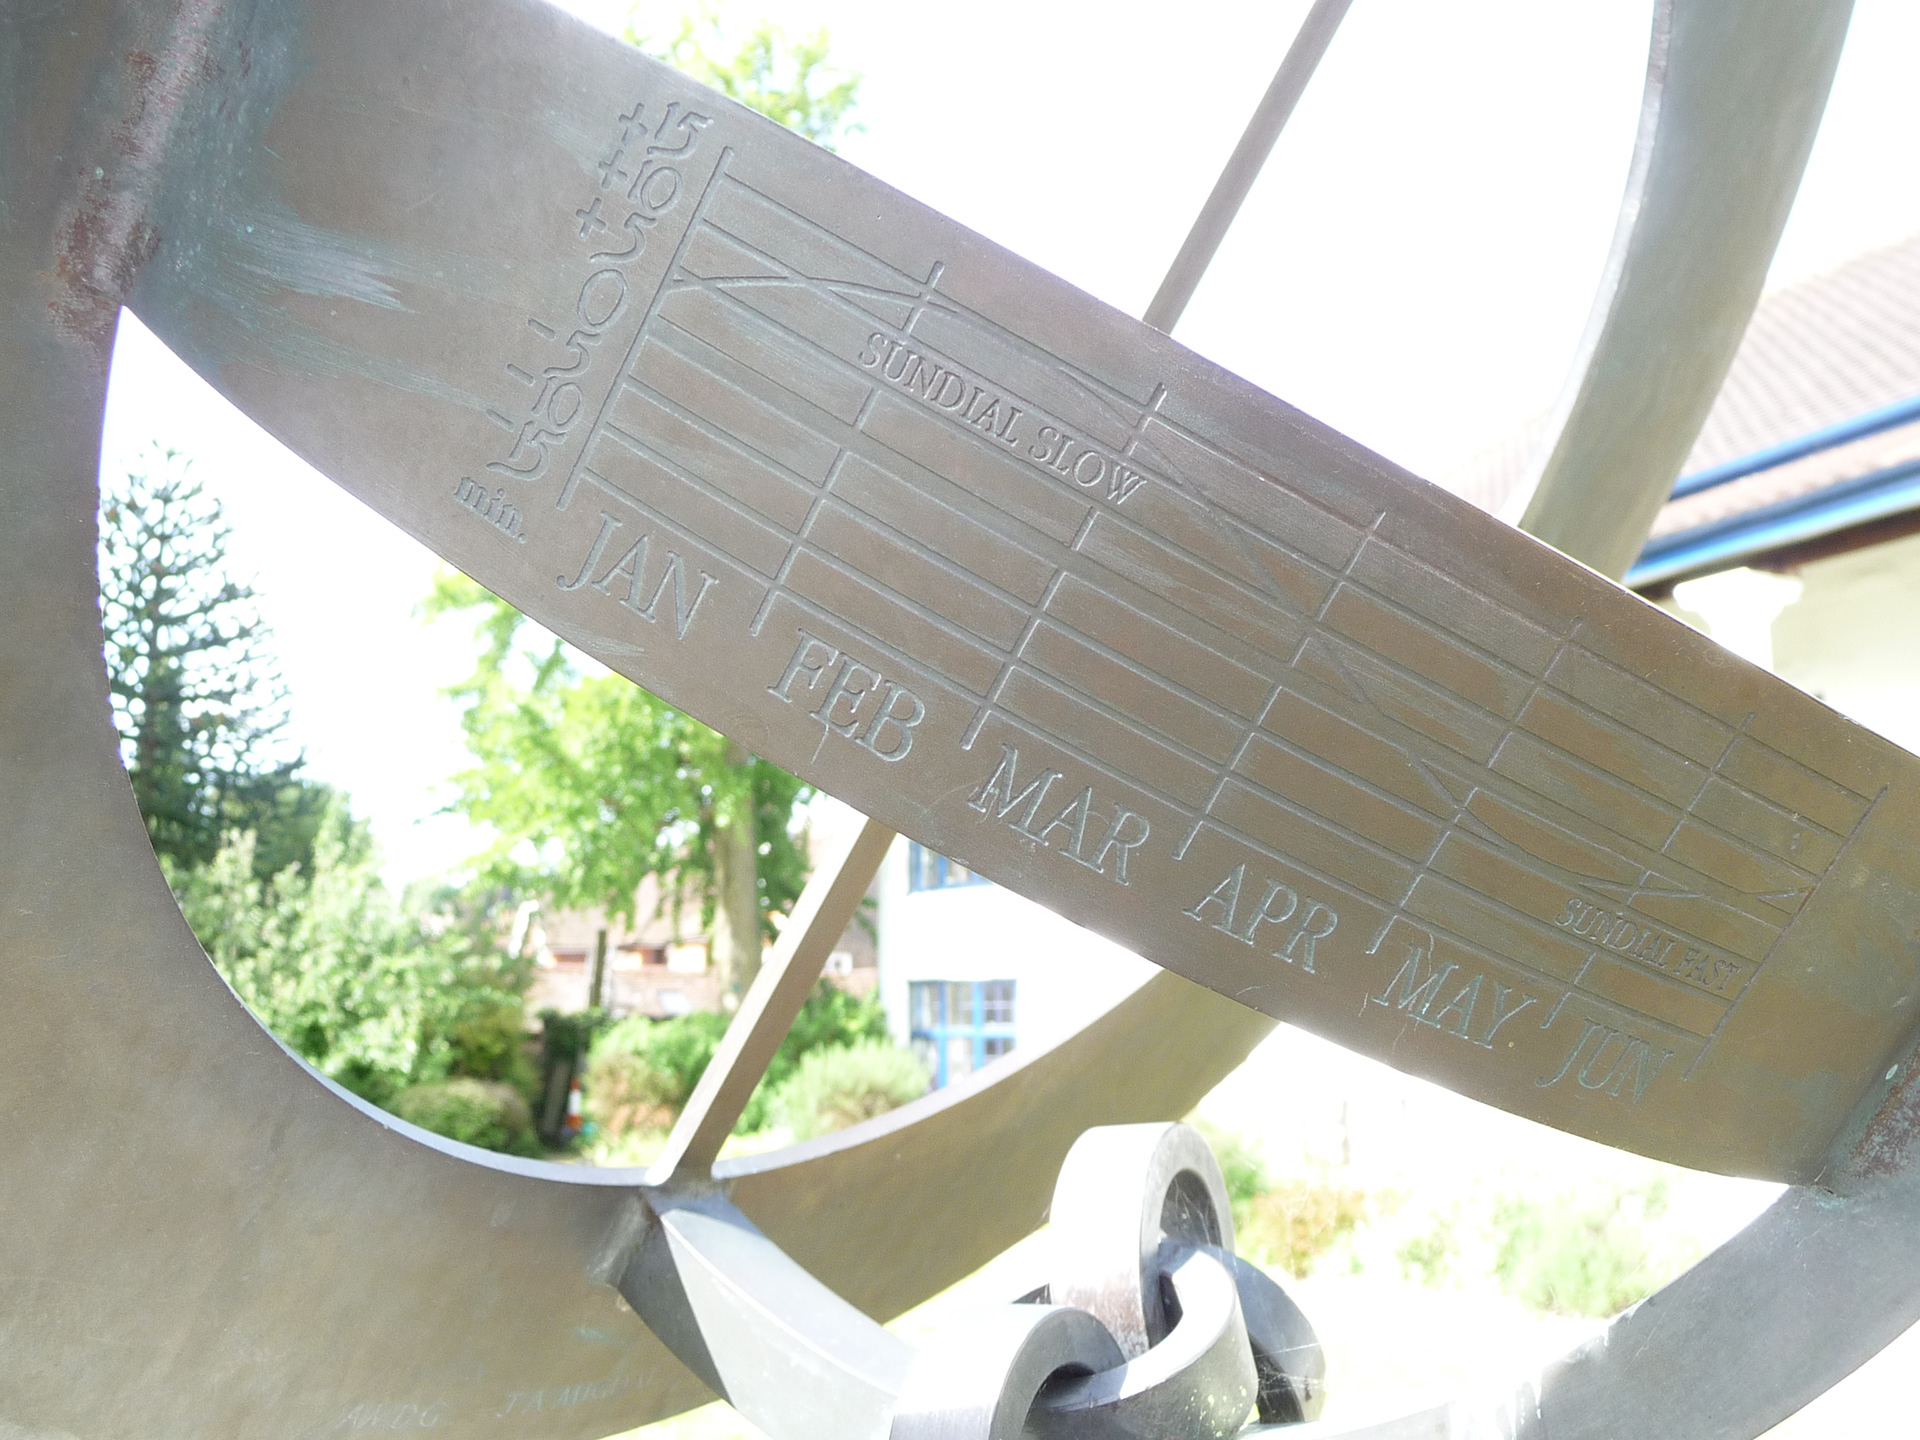
Joanna Migdal - 2002 - Haslemere Museum - Back of Equatorial Ring
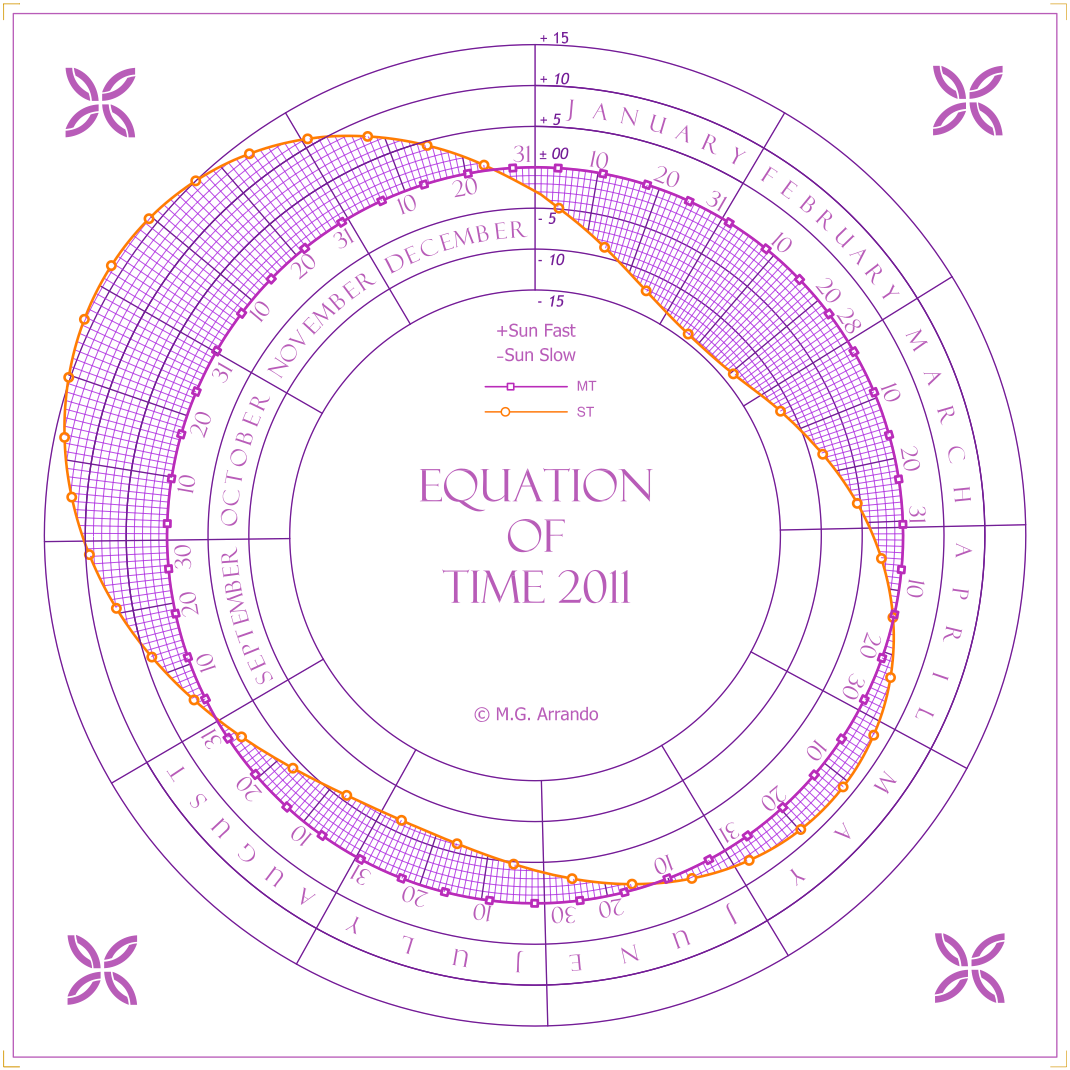
Polar Graph by M.G. Arrando
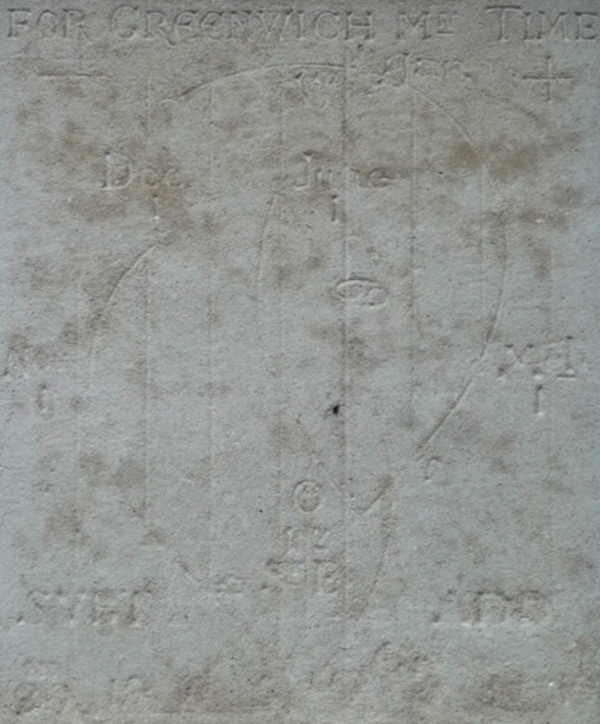
Intrinsic Graph from Bury St Edmunds
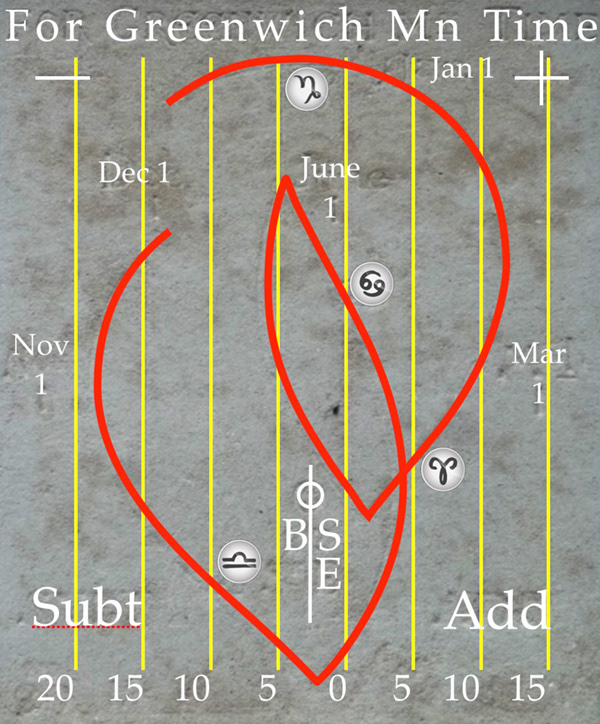
Intrinsic Graph from Bury St Edmunds - clarified
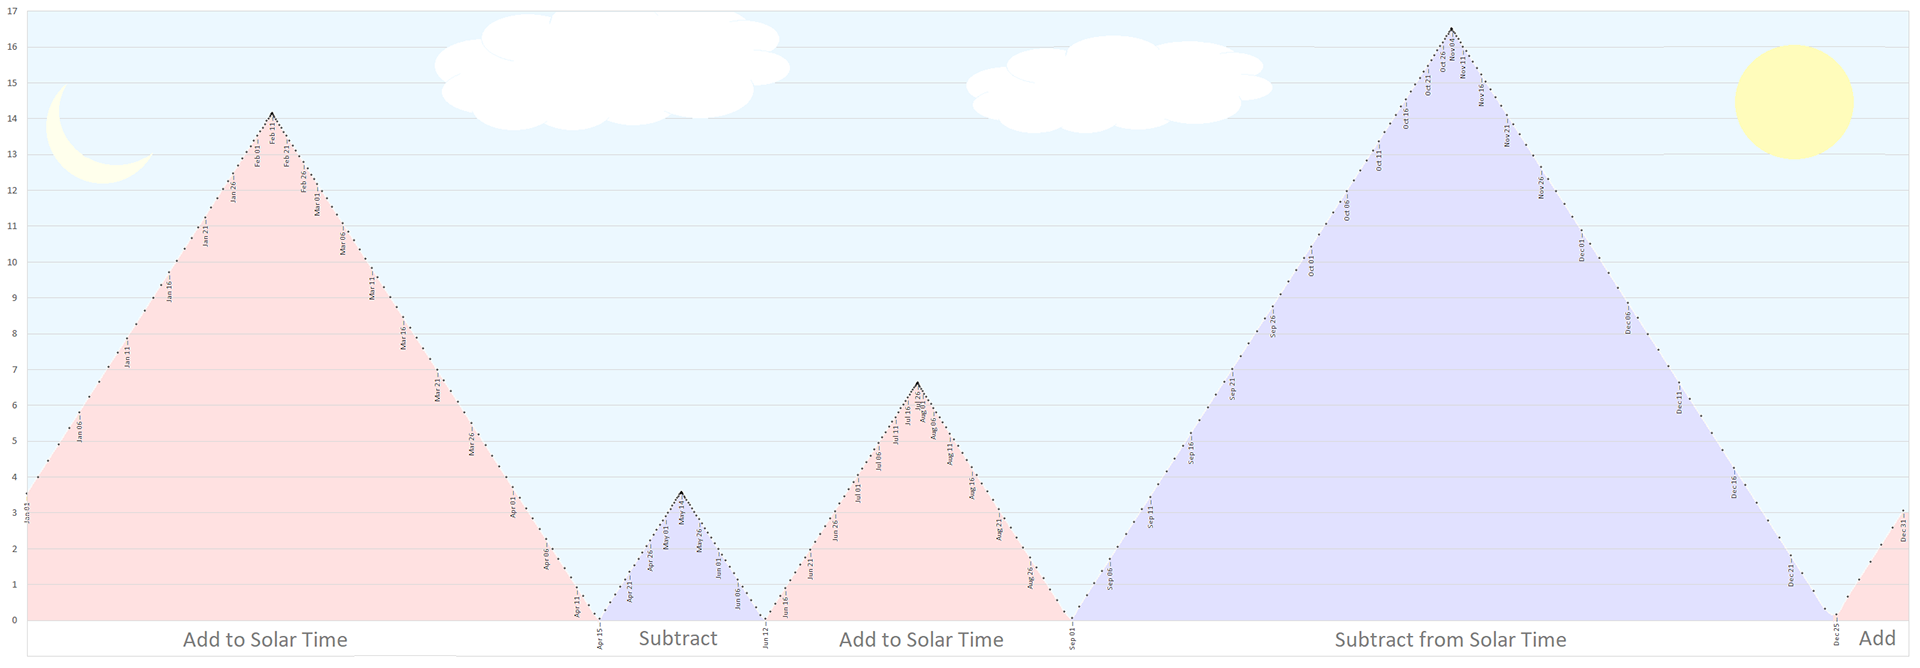
Intrinsic 'Flame' Graph on a dial by the Author - see below for further details
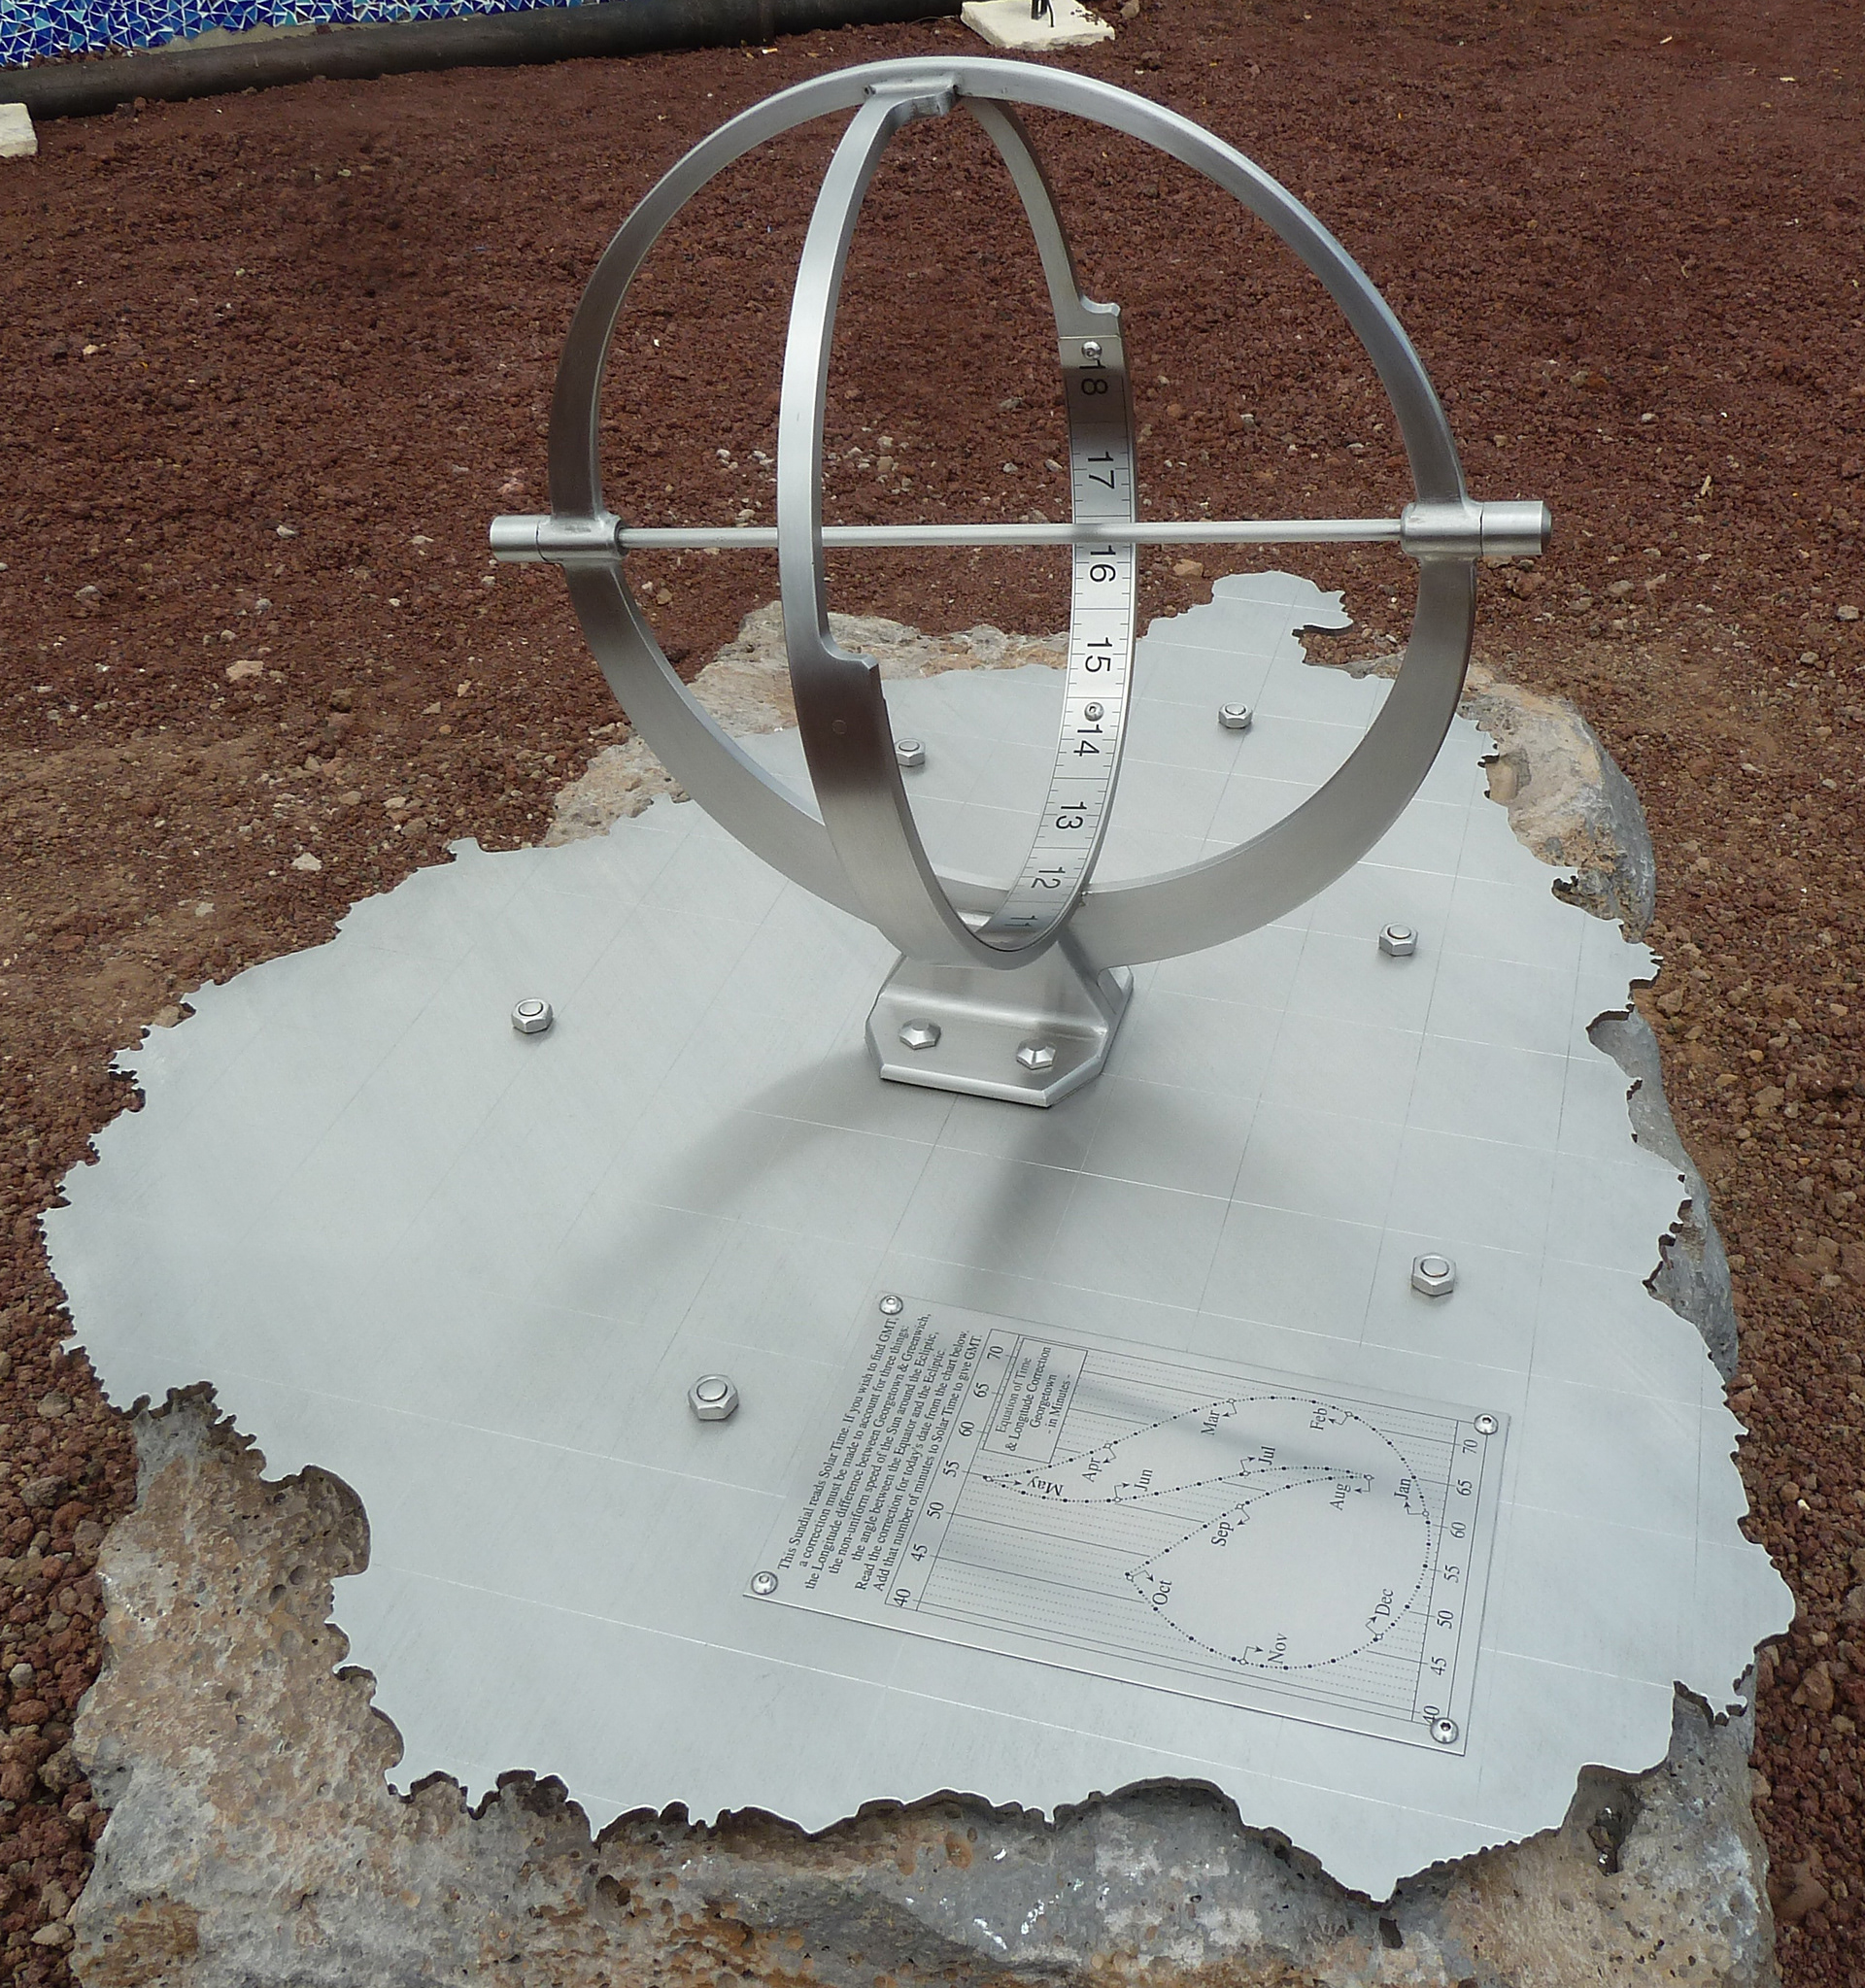
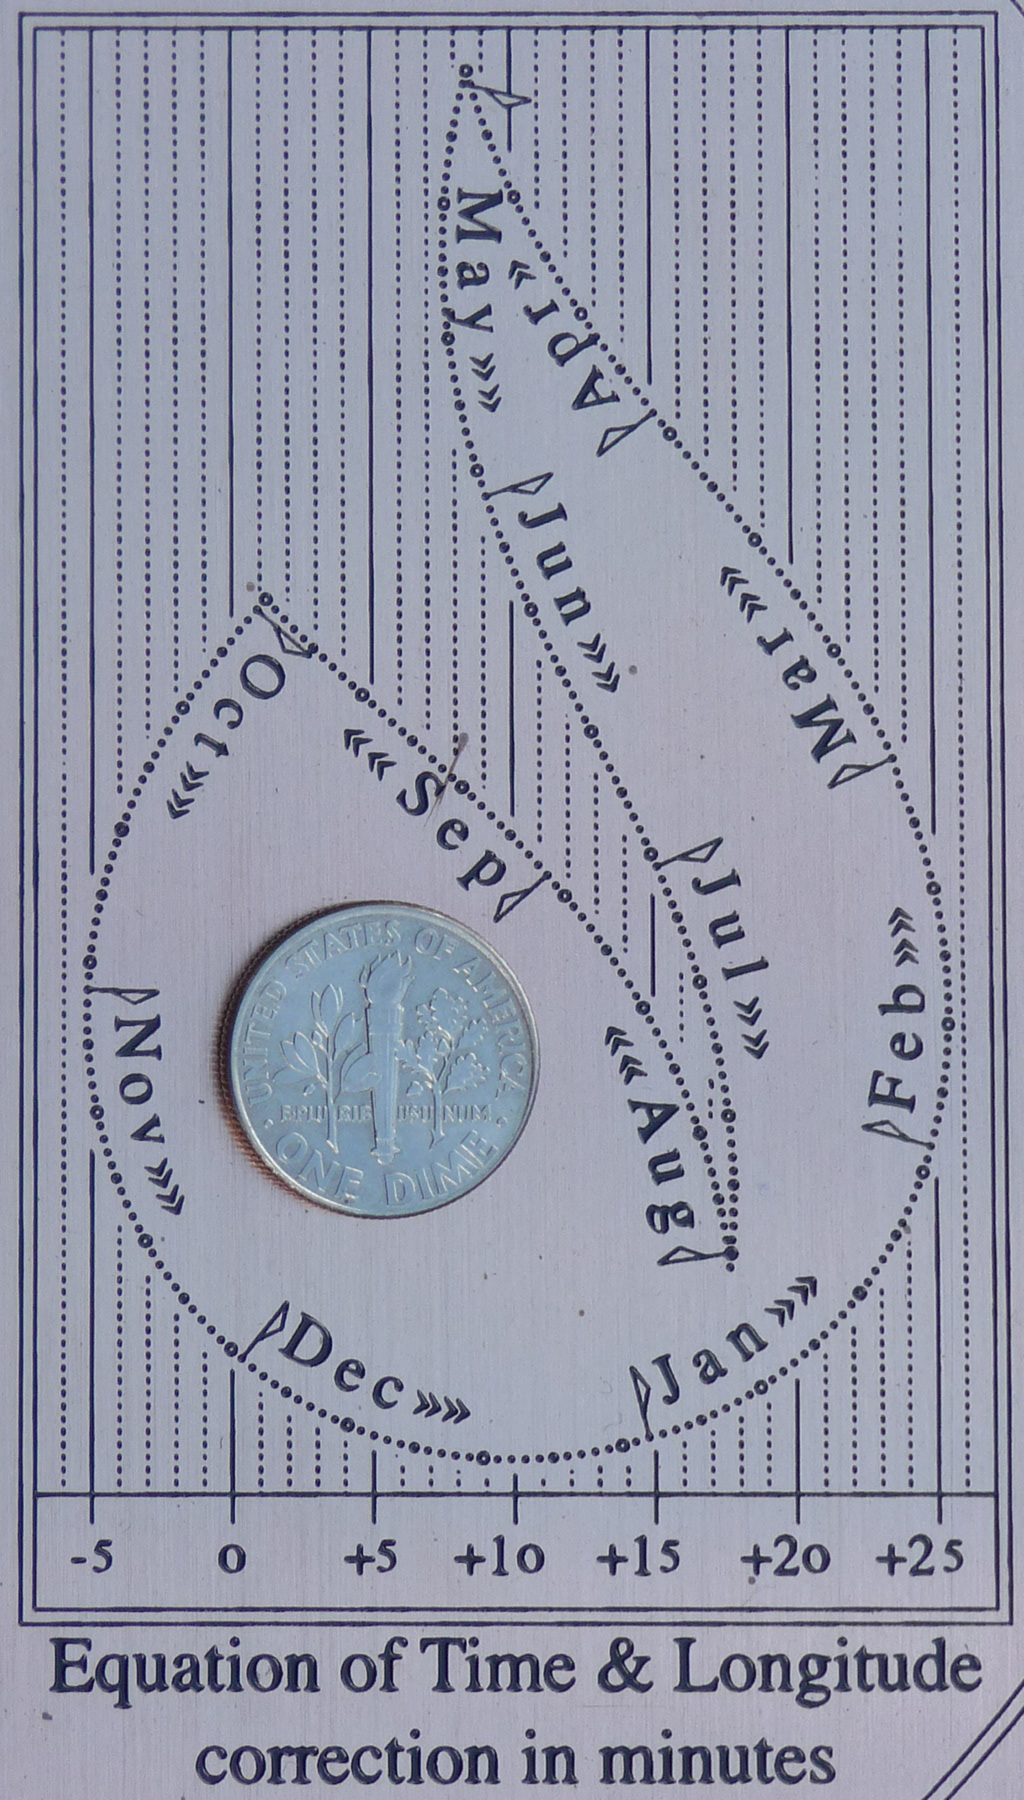
Ascension Island Dial (7°55' S 14°24' W) - 2015, delineated by the Author
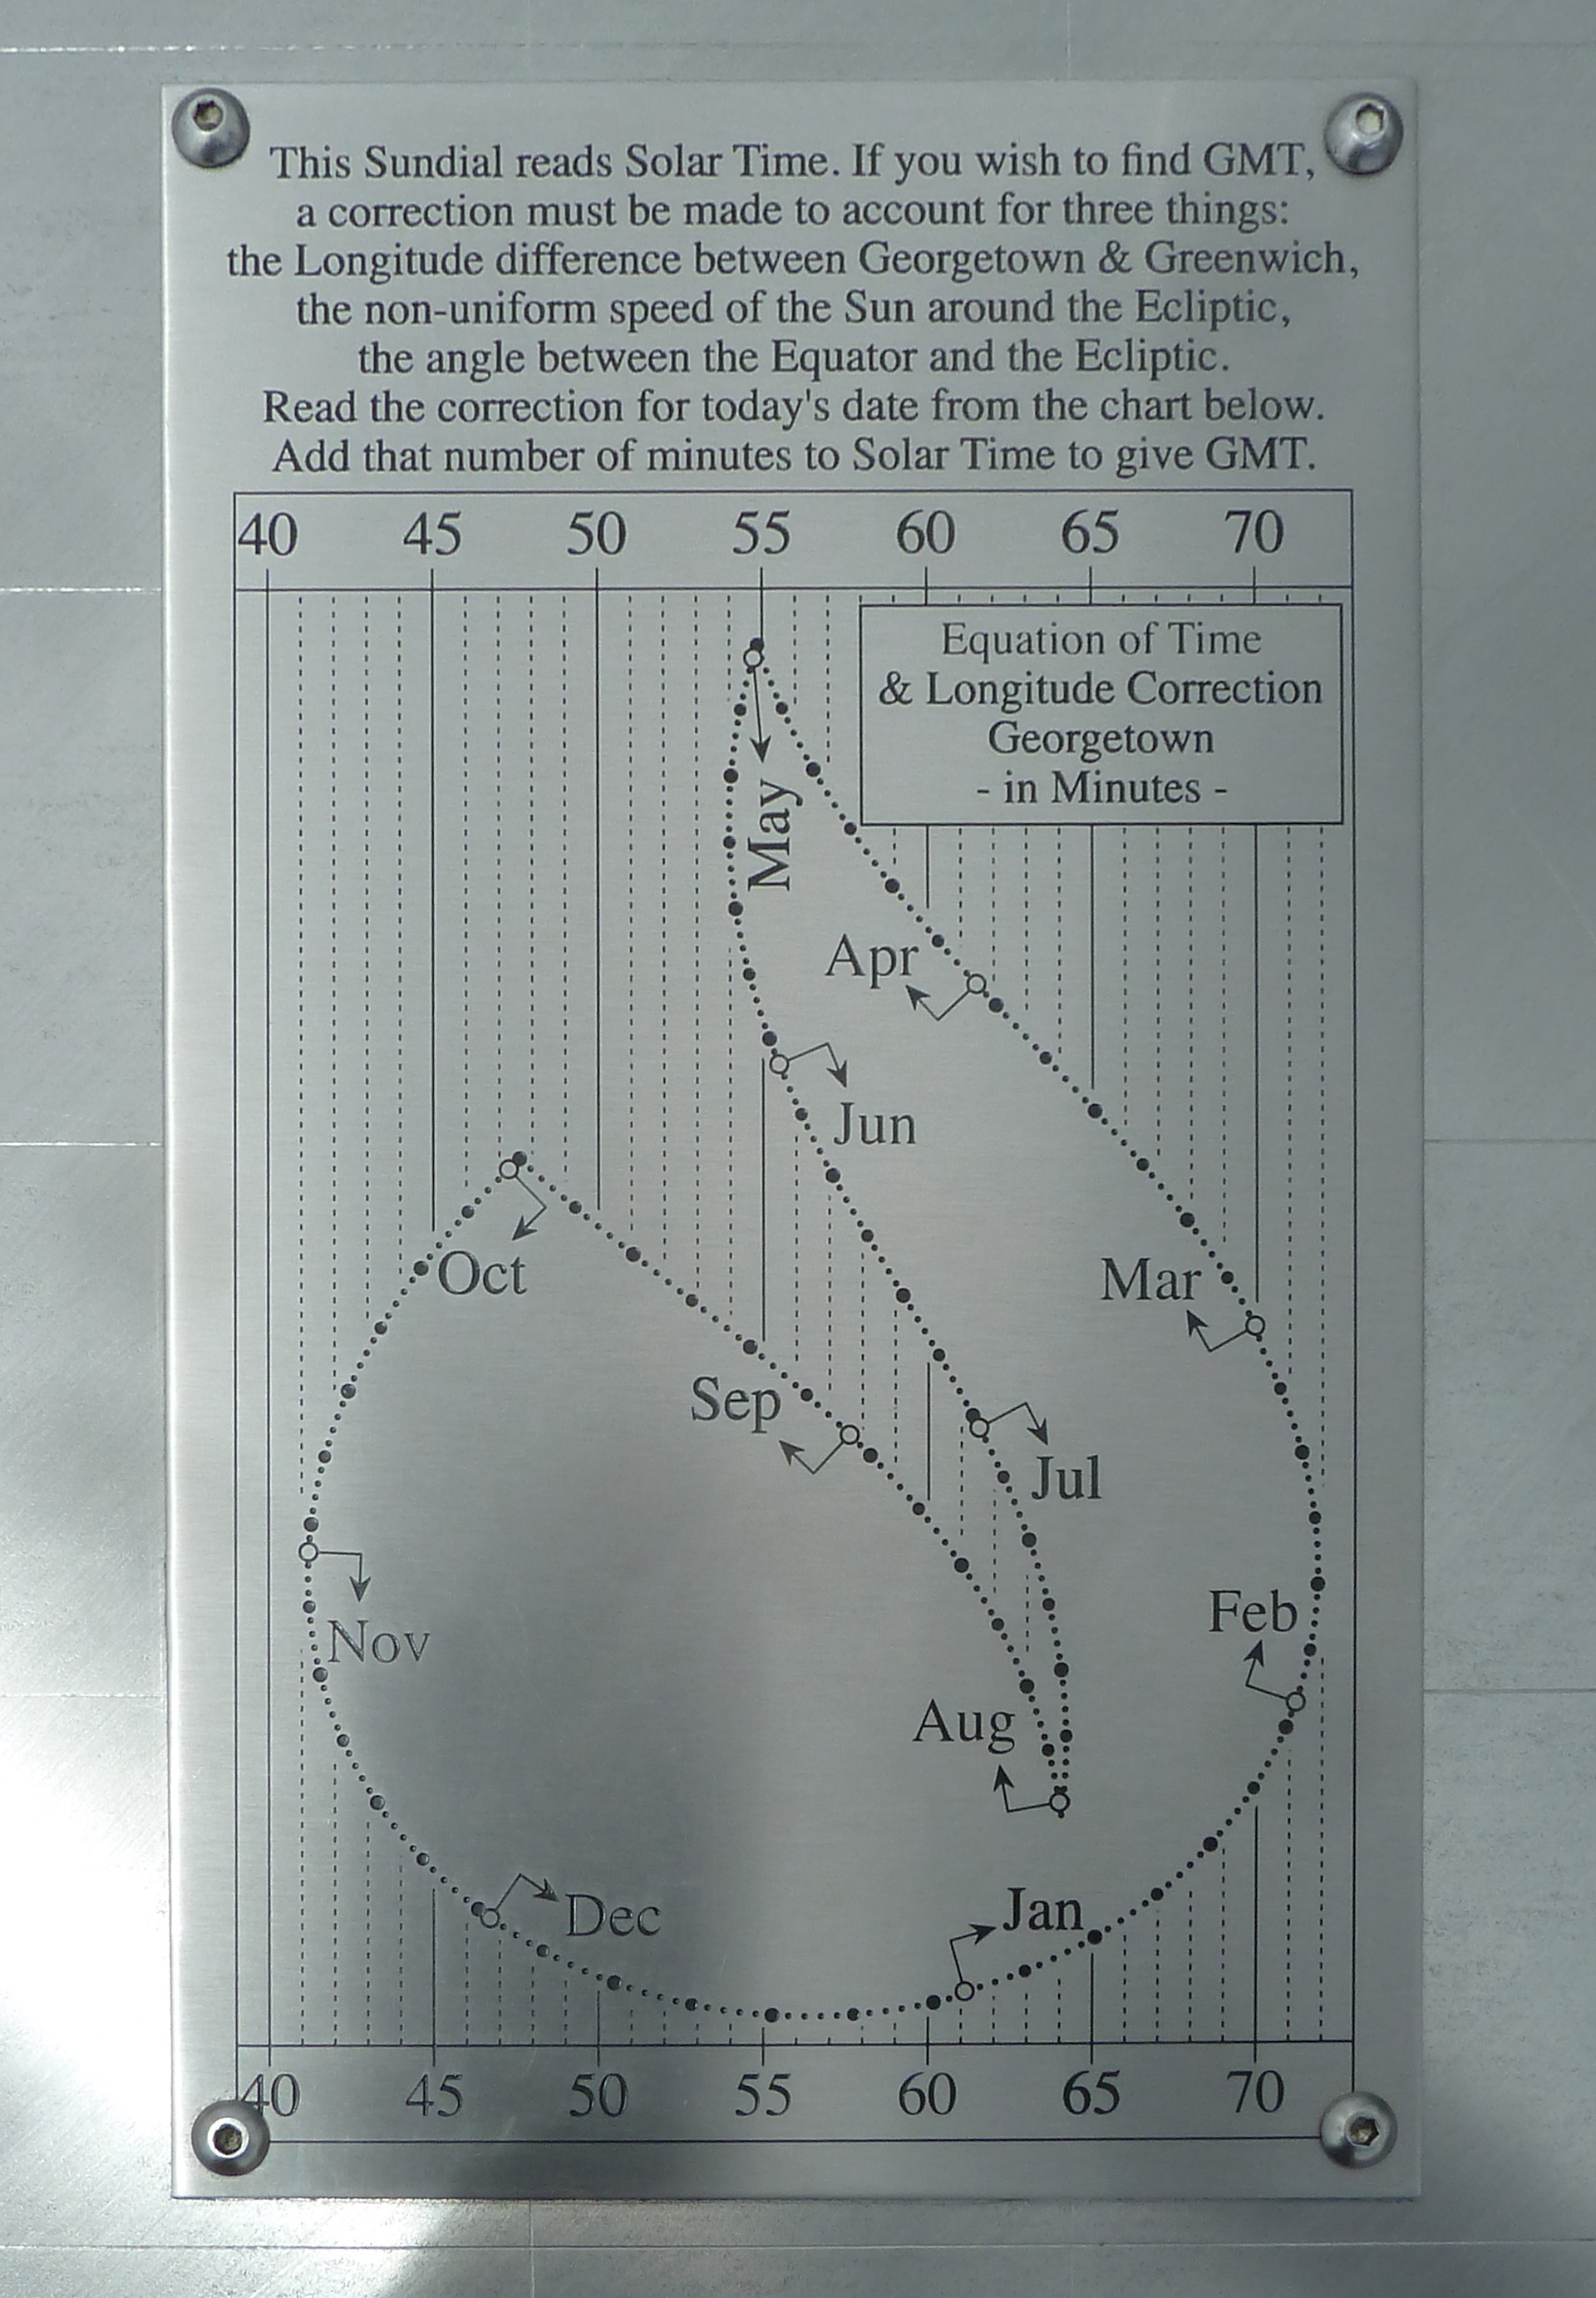
Detail of the Ascension Island Dial
Click on images to enlarge & view captions
... AS AN ANALEMMA ... ON OBJECTS
The Analemma is a graph of the Equation of Time plotted against the Declination of the Sun. This portrayal is seen particularly in Noon Mark sundials. The analemma was also added to globes, as a illustration - (often to fill the large blue space occupied by the Pacific Ocean)..
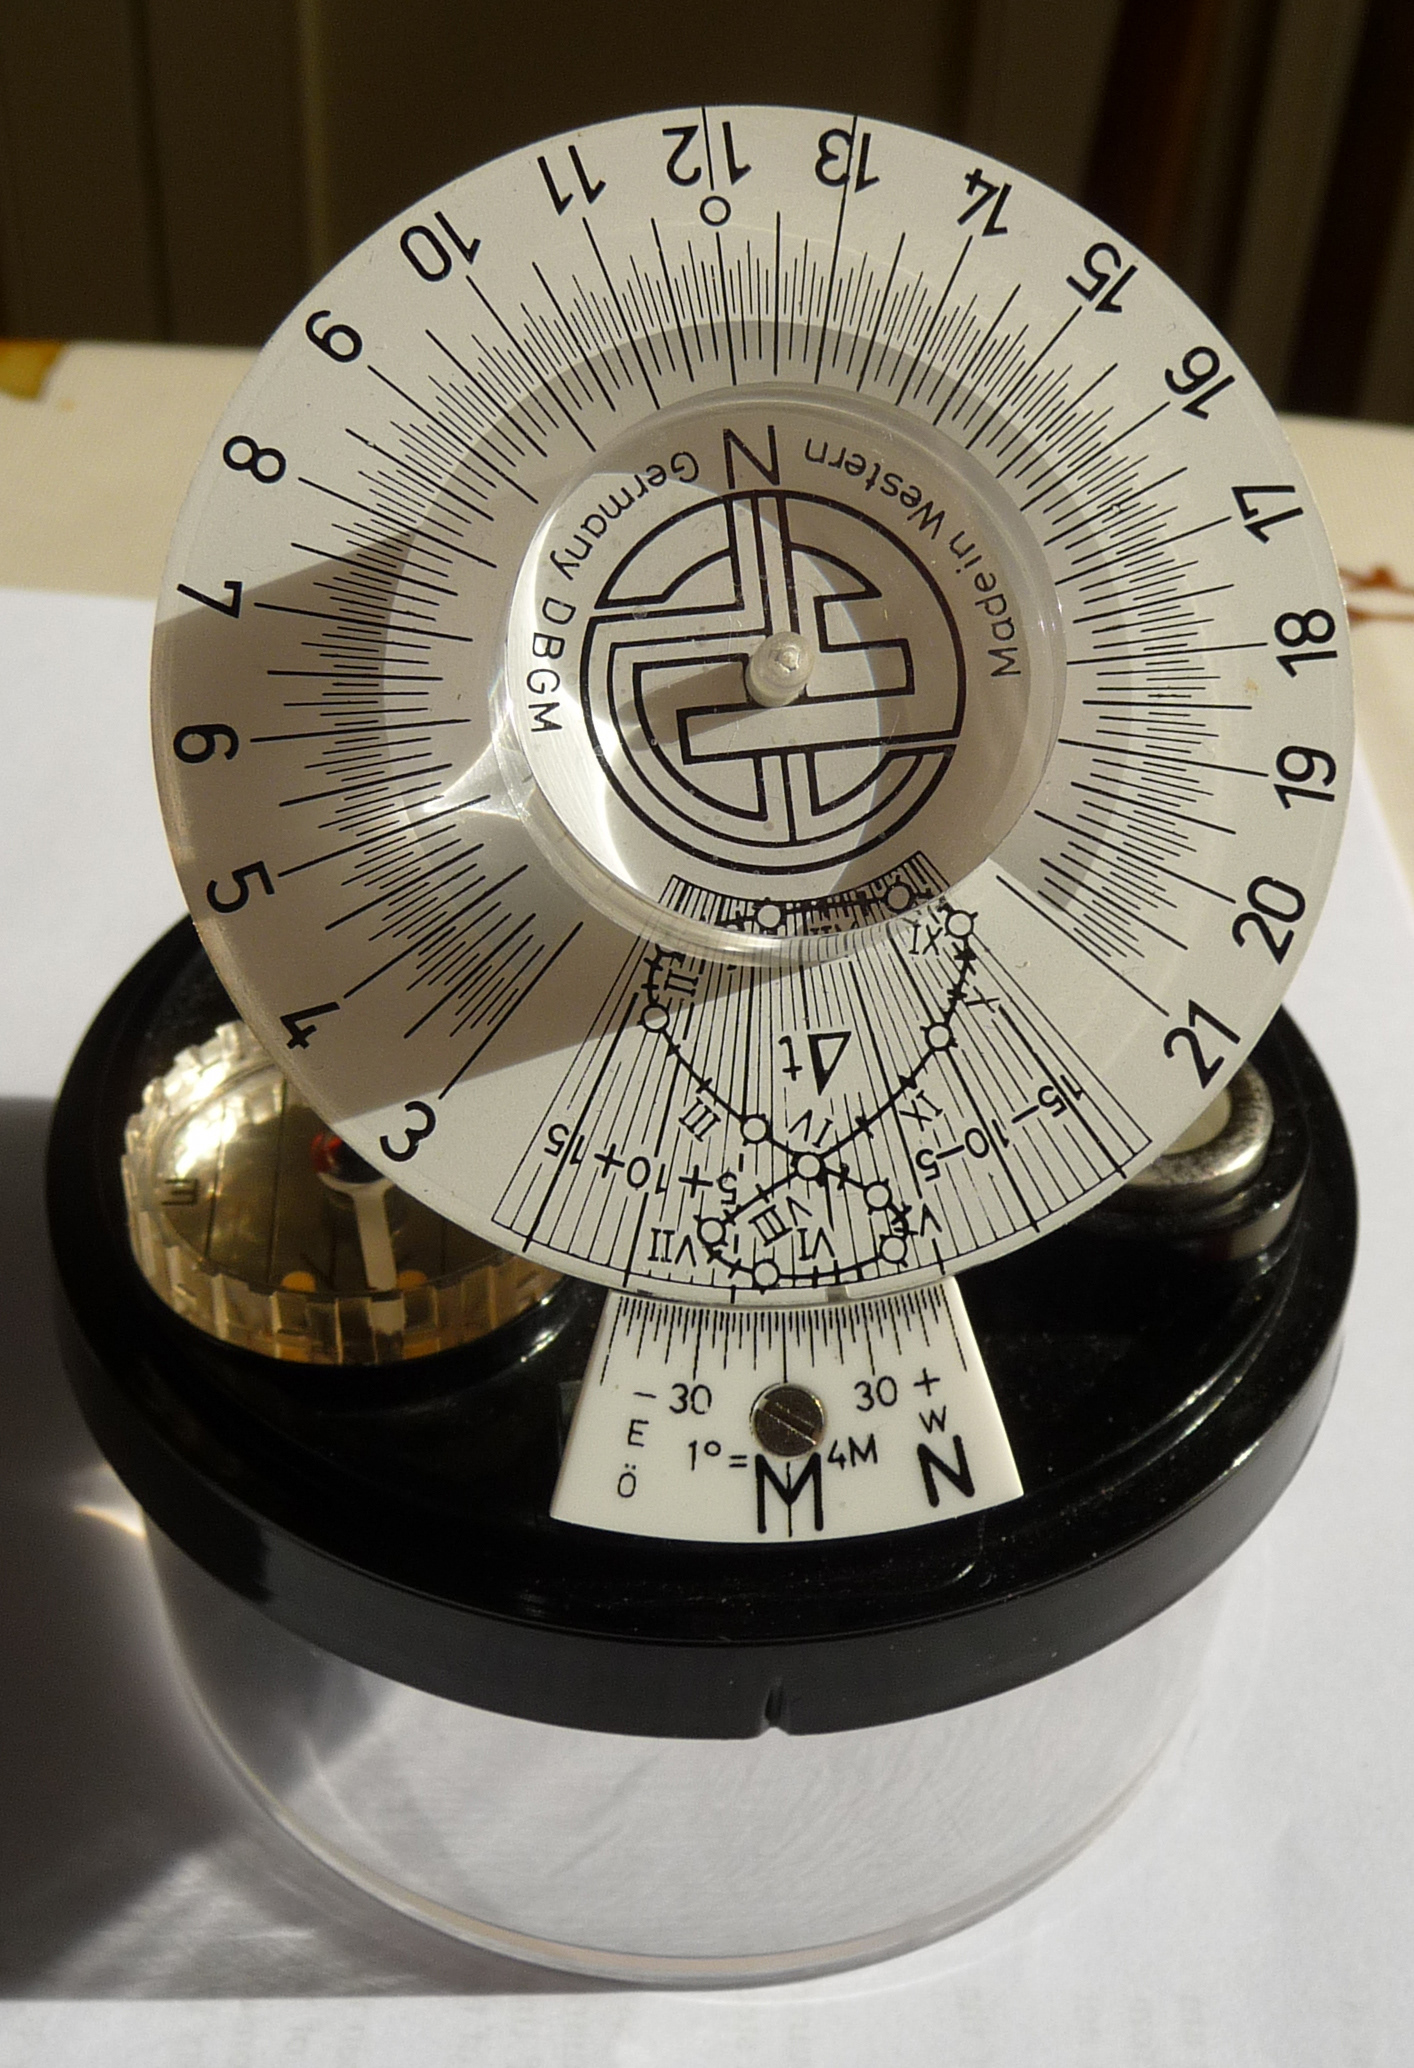
Edward Pollahne's improved Benoy-Type dial www.meku-pollaehne.de
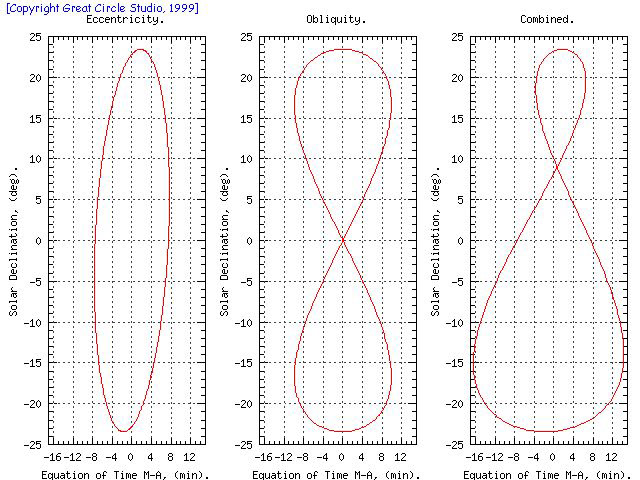
Graph showing the Ellipticity & Obliquity effects of the EoT added together to make the Analemma
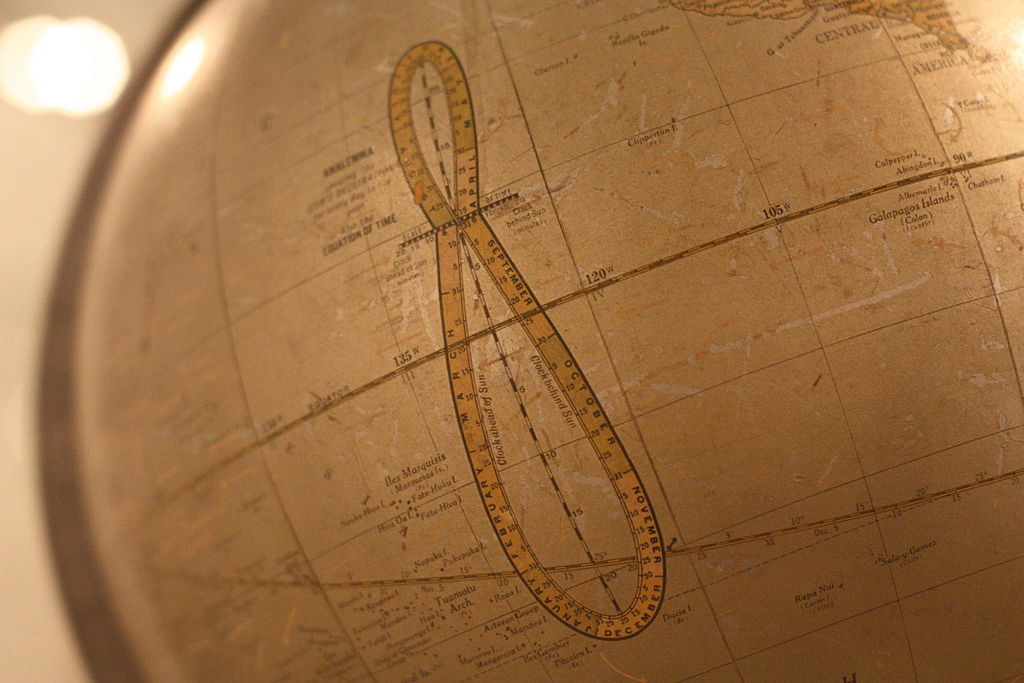
Victorian globe displaying the analemma
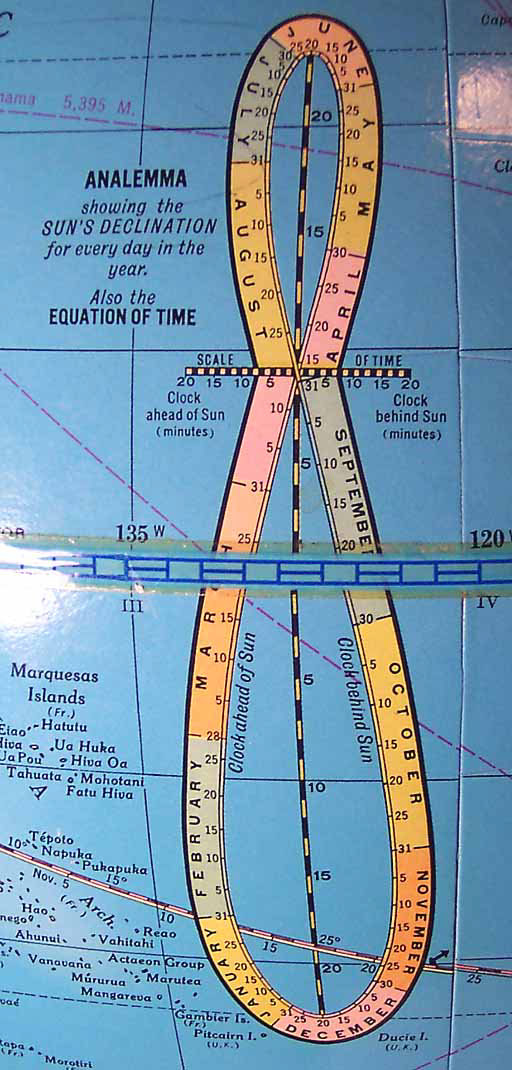
Modern globes displaying the analemma
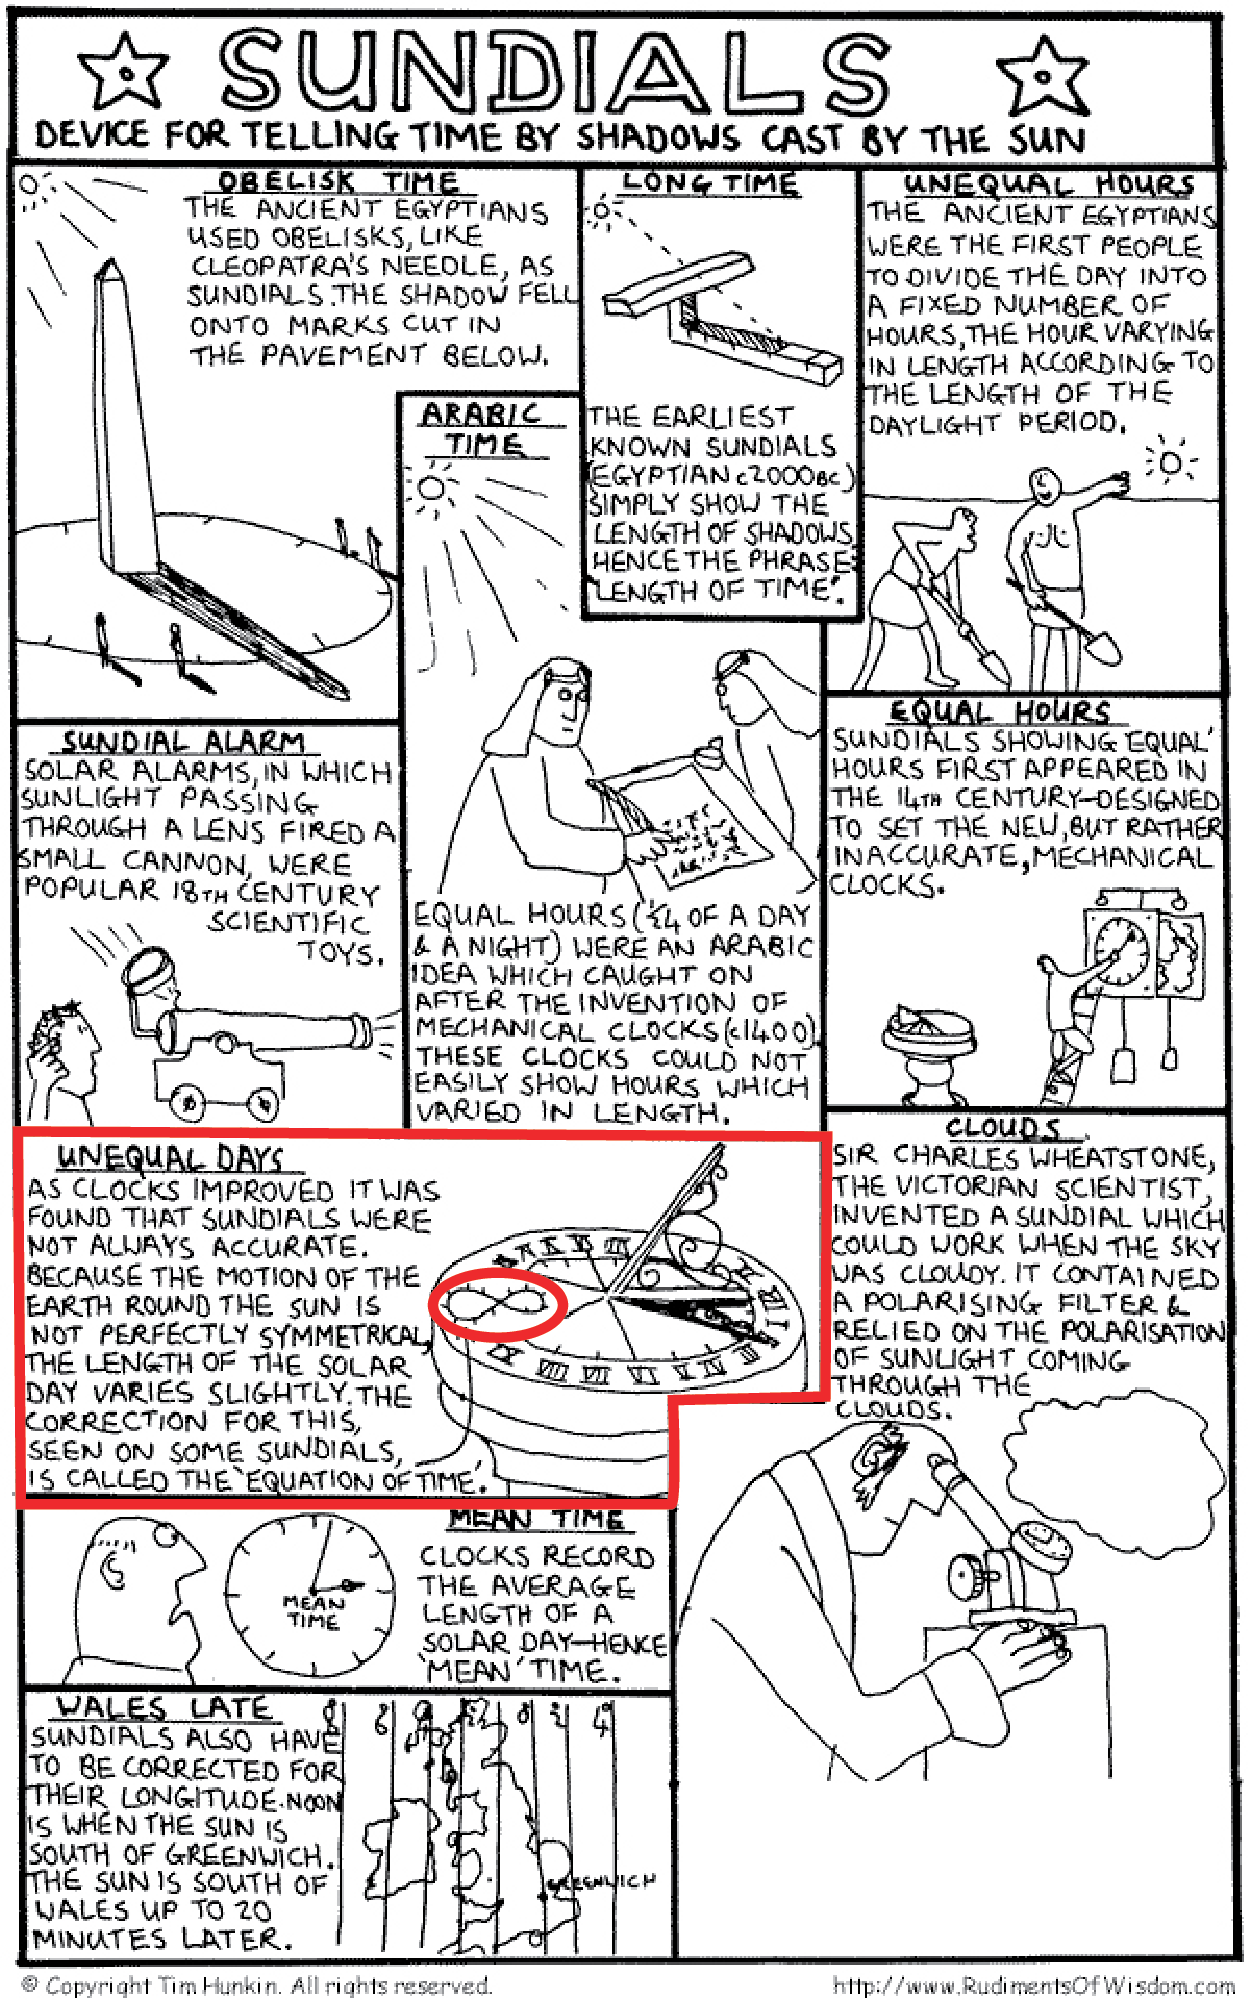
by Tim Hunkin - www.timhunkin.com
Click on images to enlarge & view captions
... AS AN ANALEMMA ... IN THE SKY
But it is also interesting that the analemma can be 'seen' in the sky with time lapse photography. A sequence of photos of the sun is taken on different days from a single location and at a set Mean time
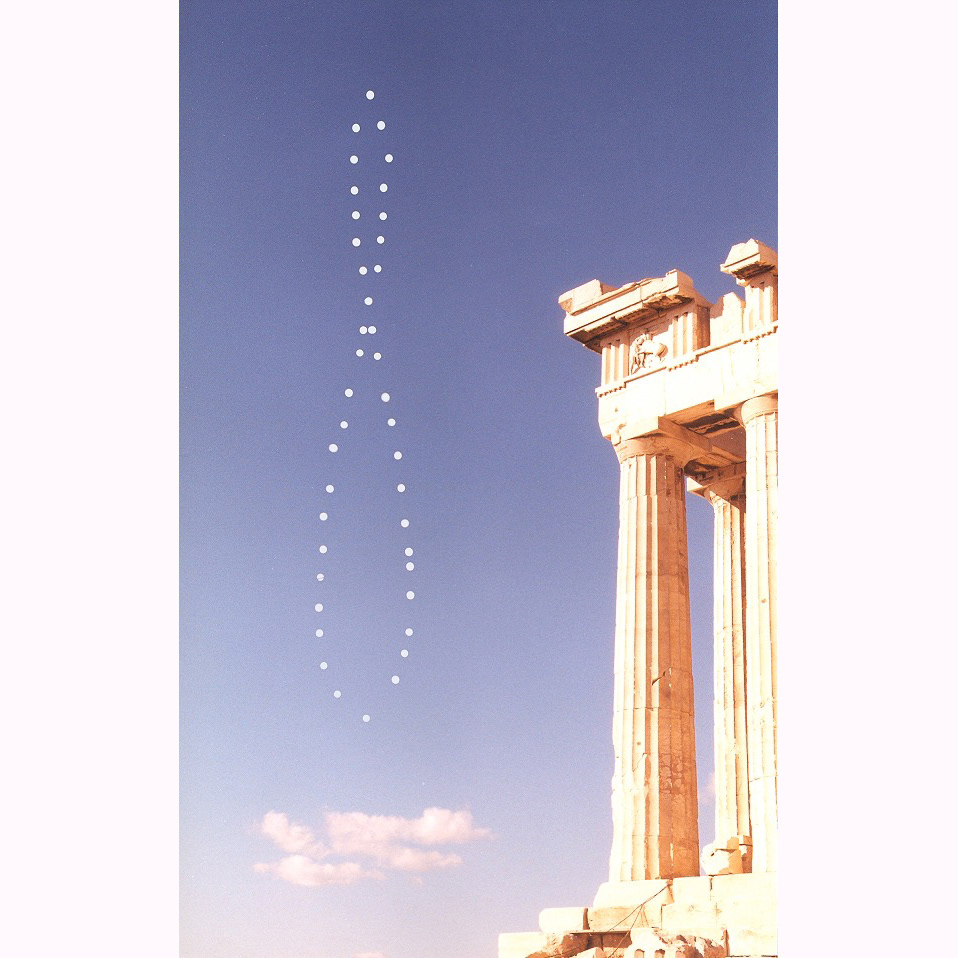
Analemma over the Parthenon by Anthony Ayiomamitis
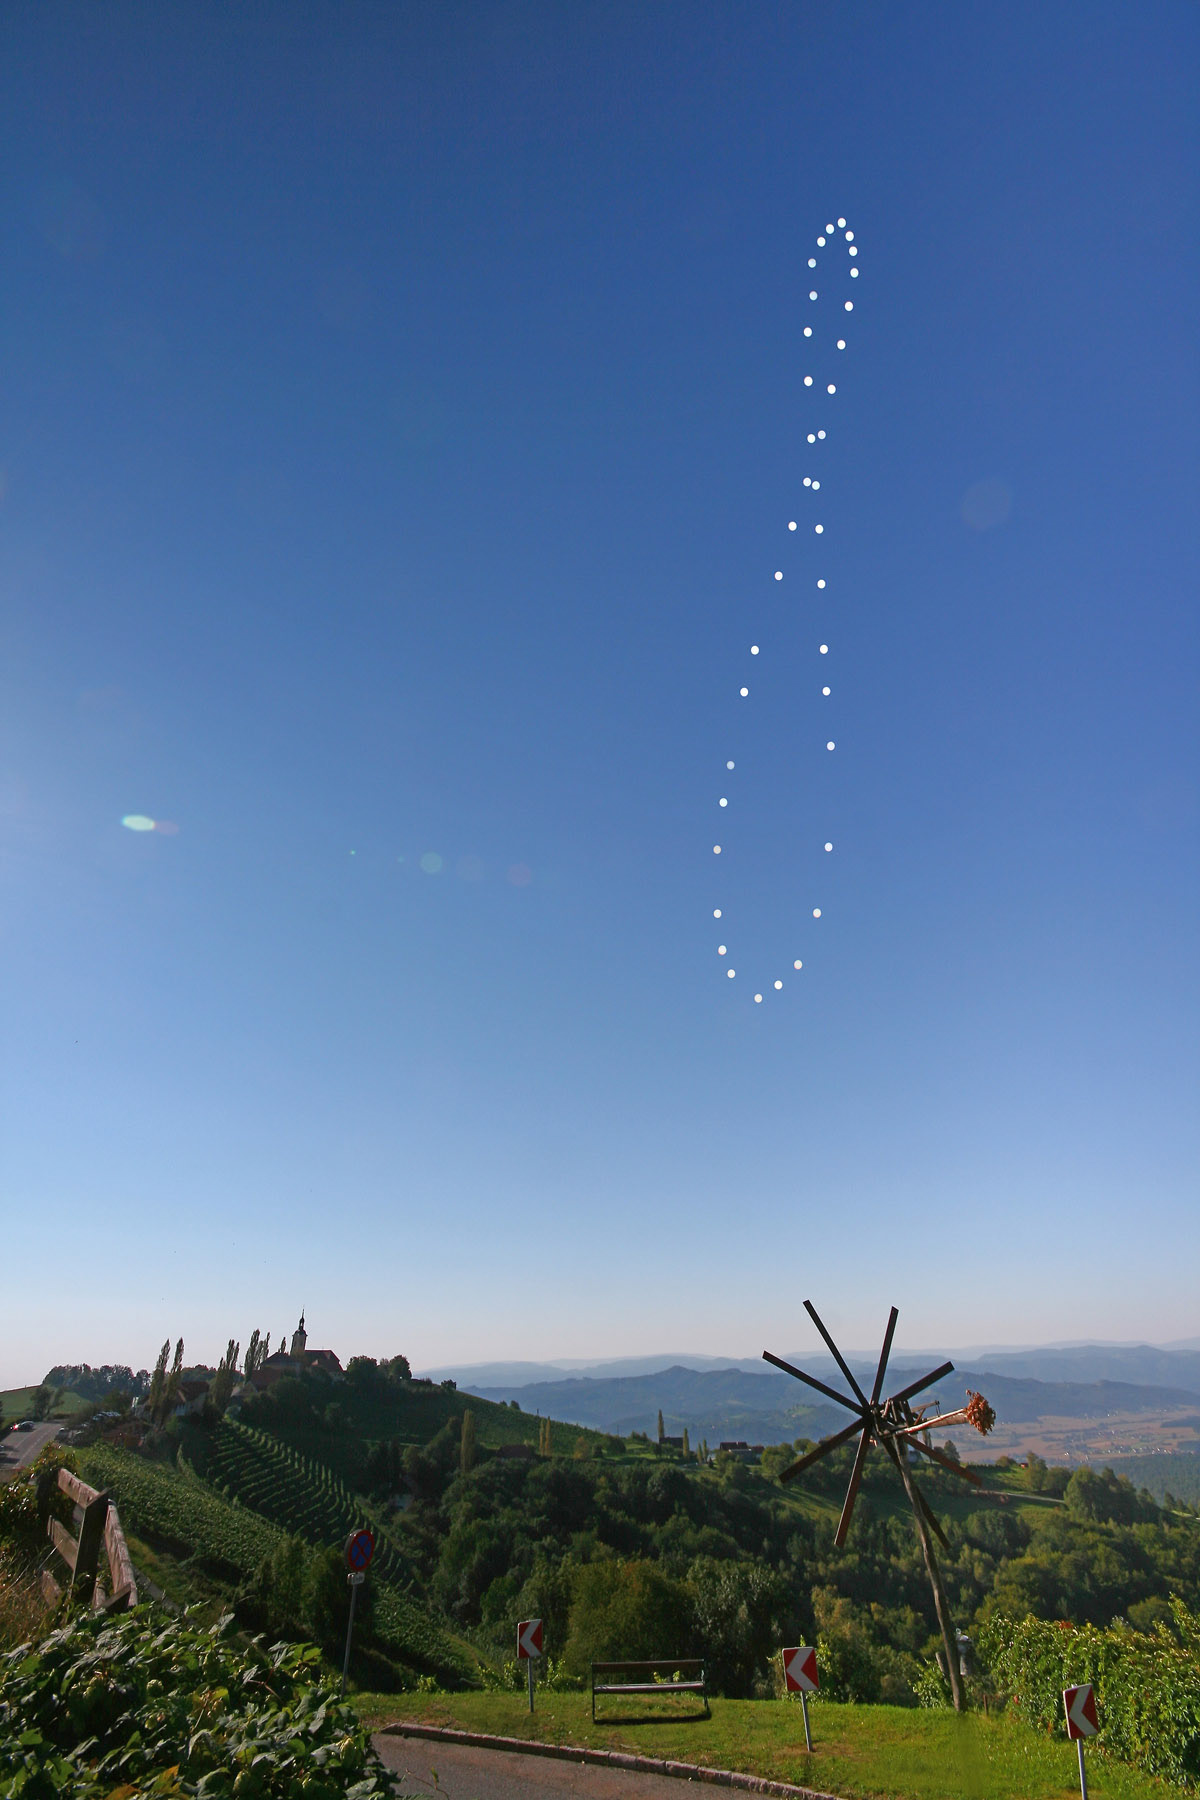
Analemma over the Austria by Robert Polzl
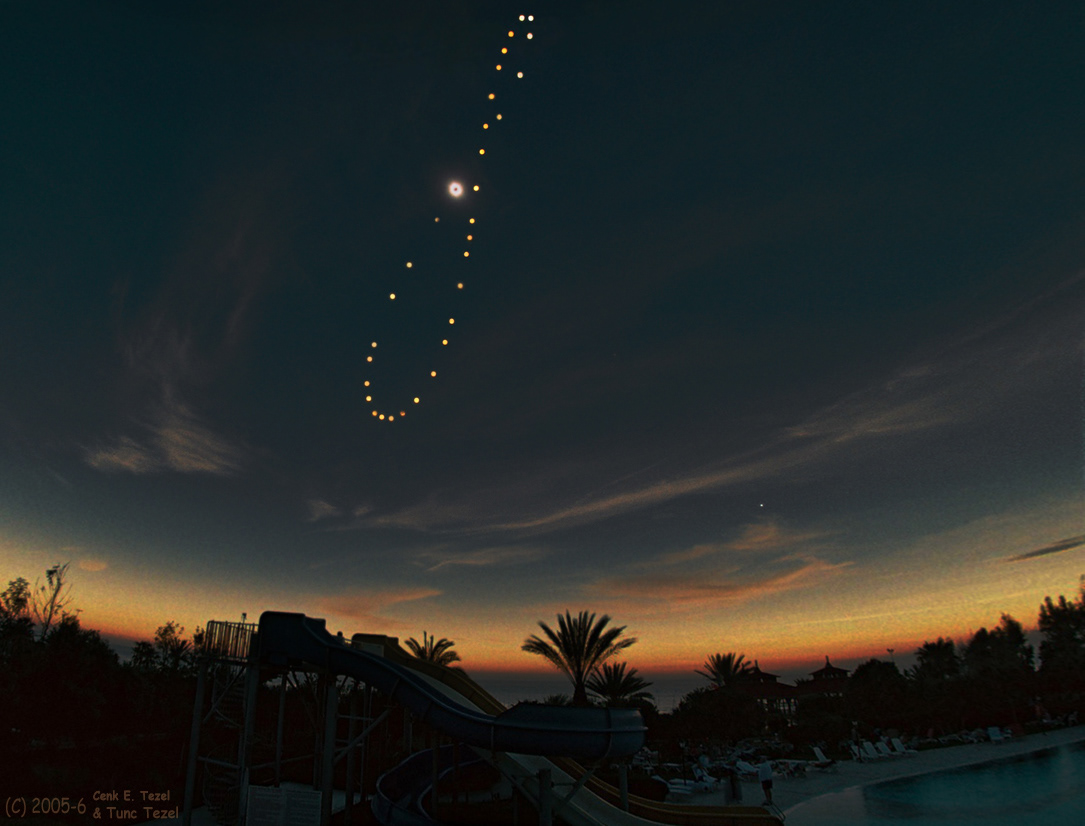
Analemma over the Turkey by Tunc Tezel
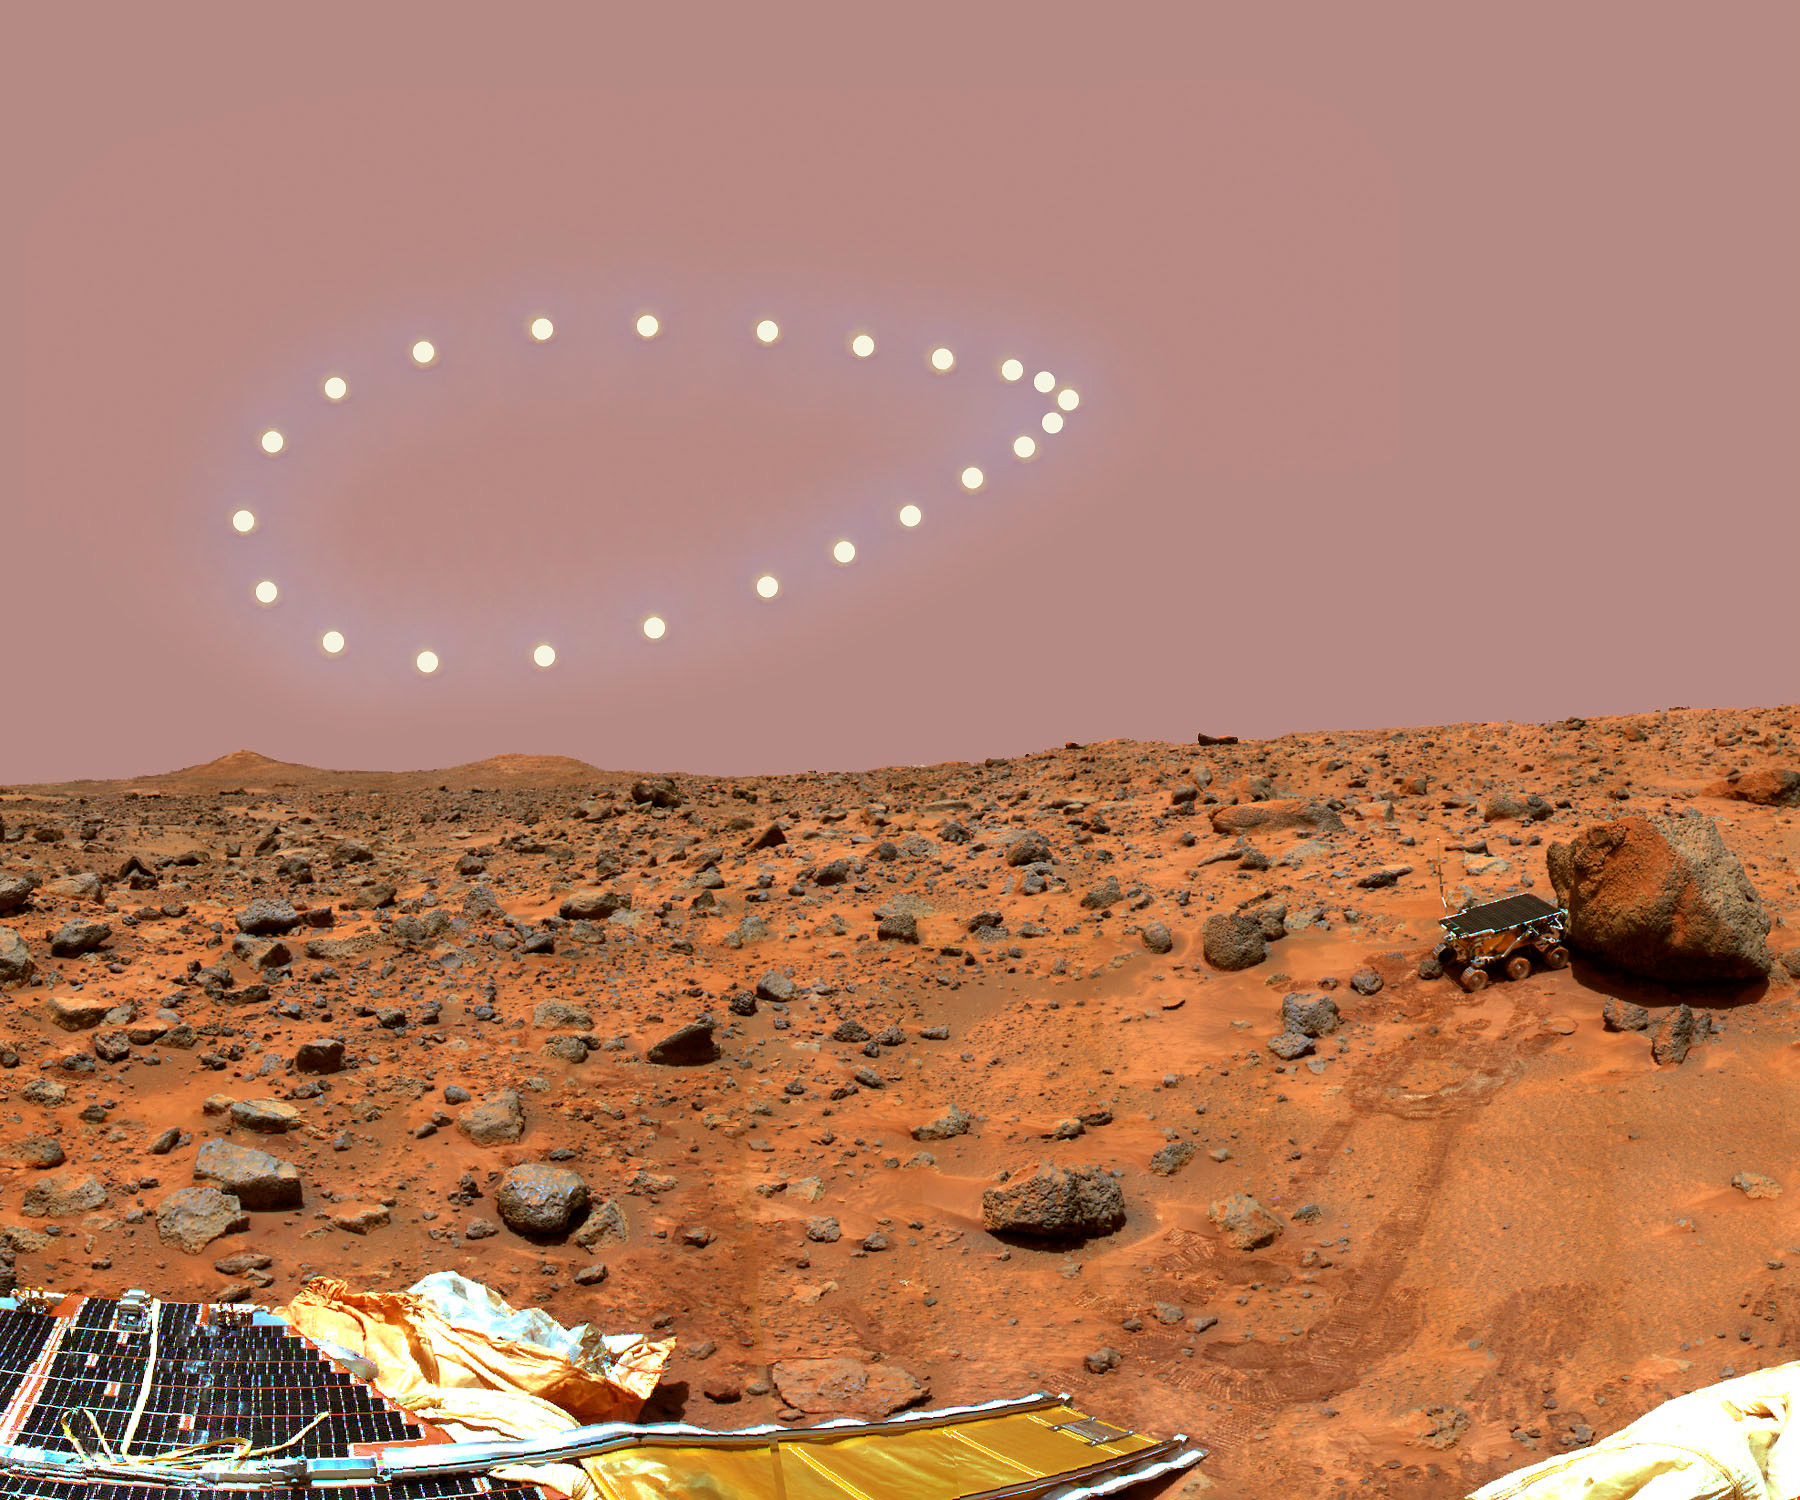
Mars Analemma by Dennis Mammana - at noon, the Mars Rover turns to a set directions and takes a picture of the sky
Click on images to enlarge & view caption
... AS A FIGURATIVE ILLUSTRATION
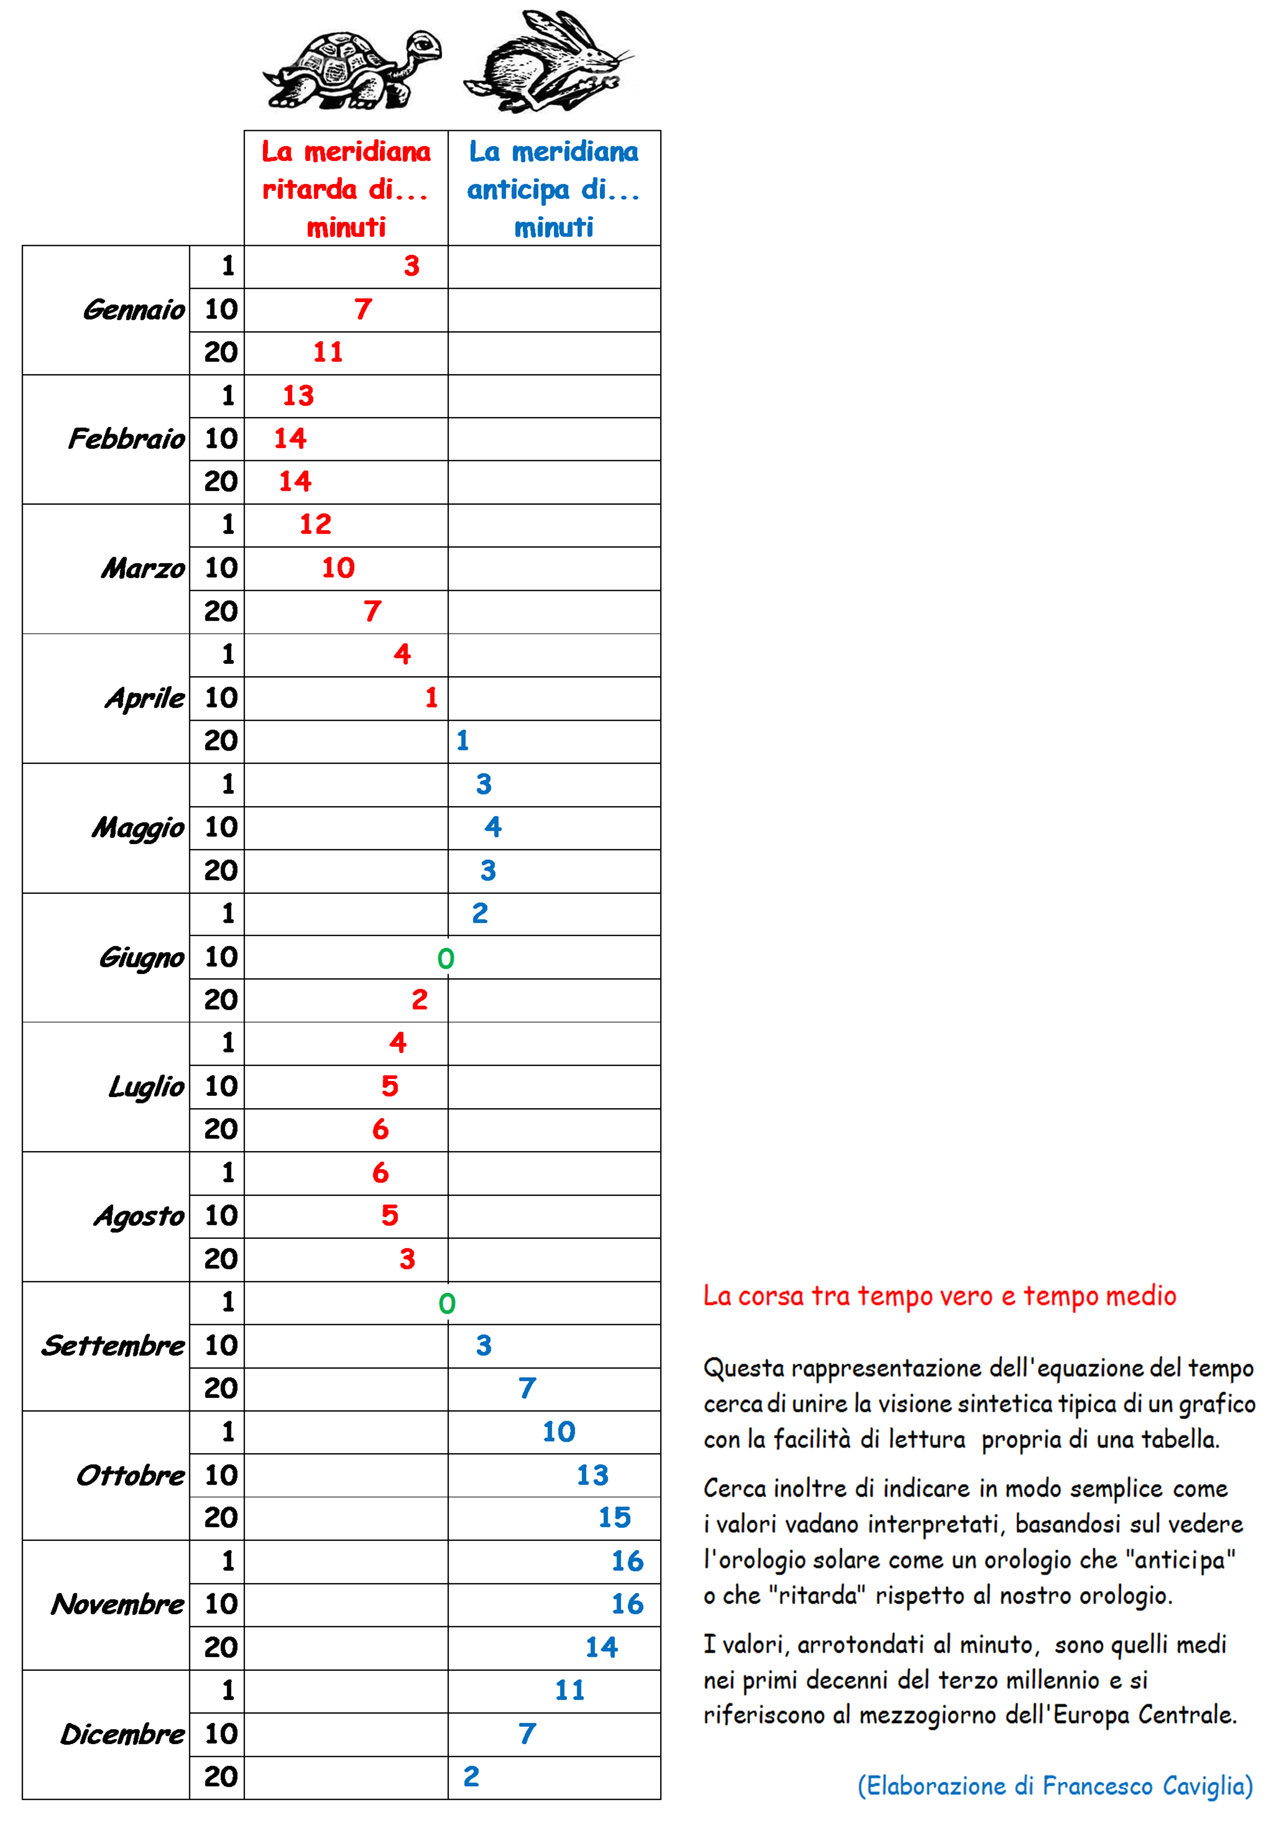
Delightful Graph by Francesco Caviglia
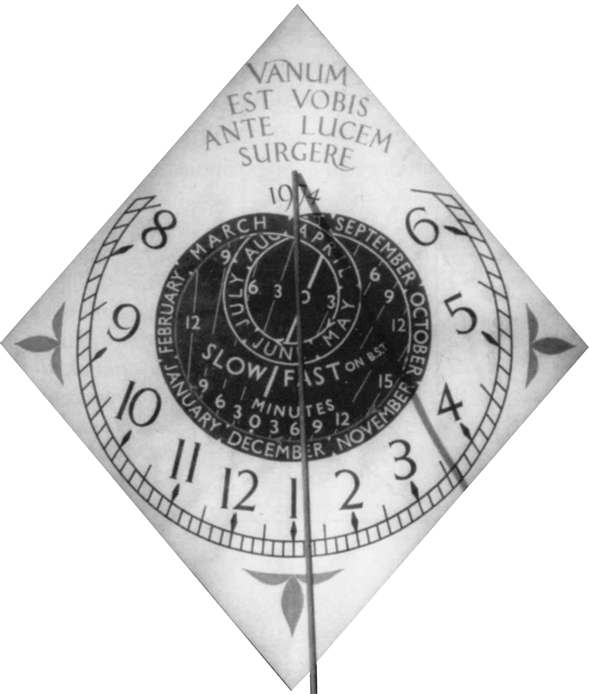
1974 Knot Dial by James Richard
Detail of 1974 Knot Dial by James Richard
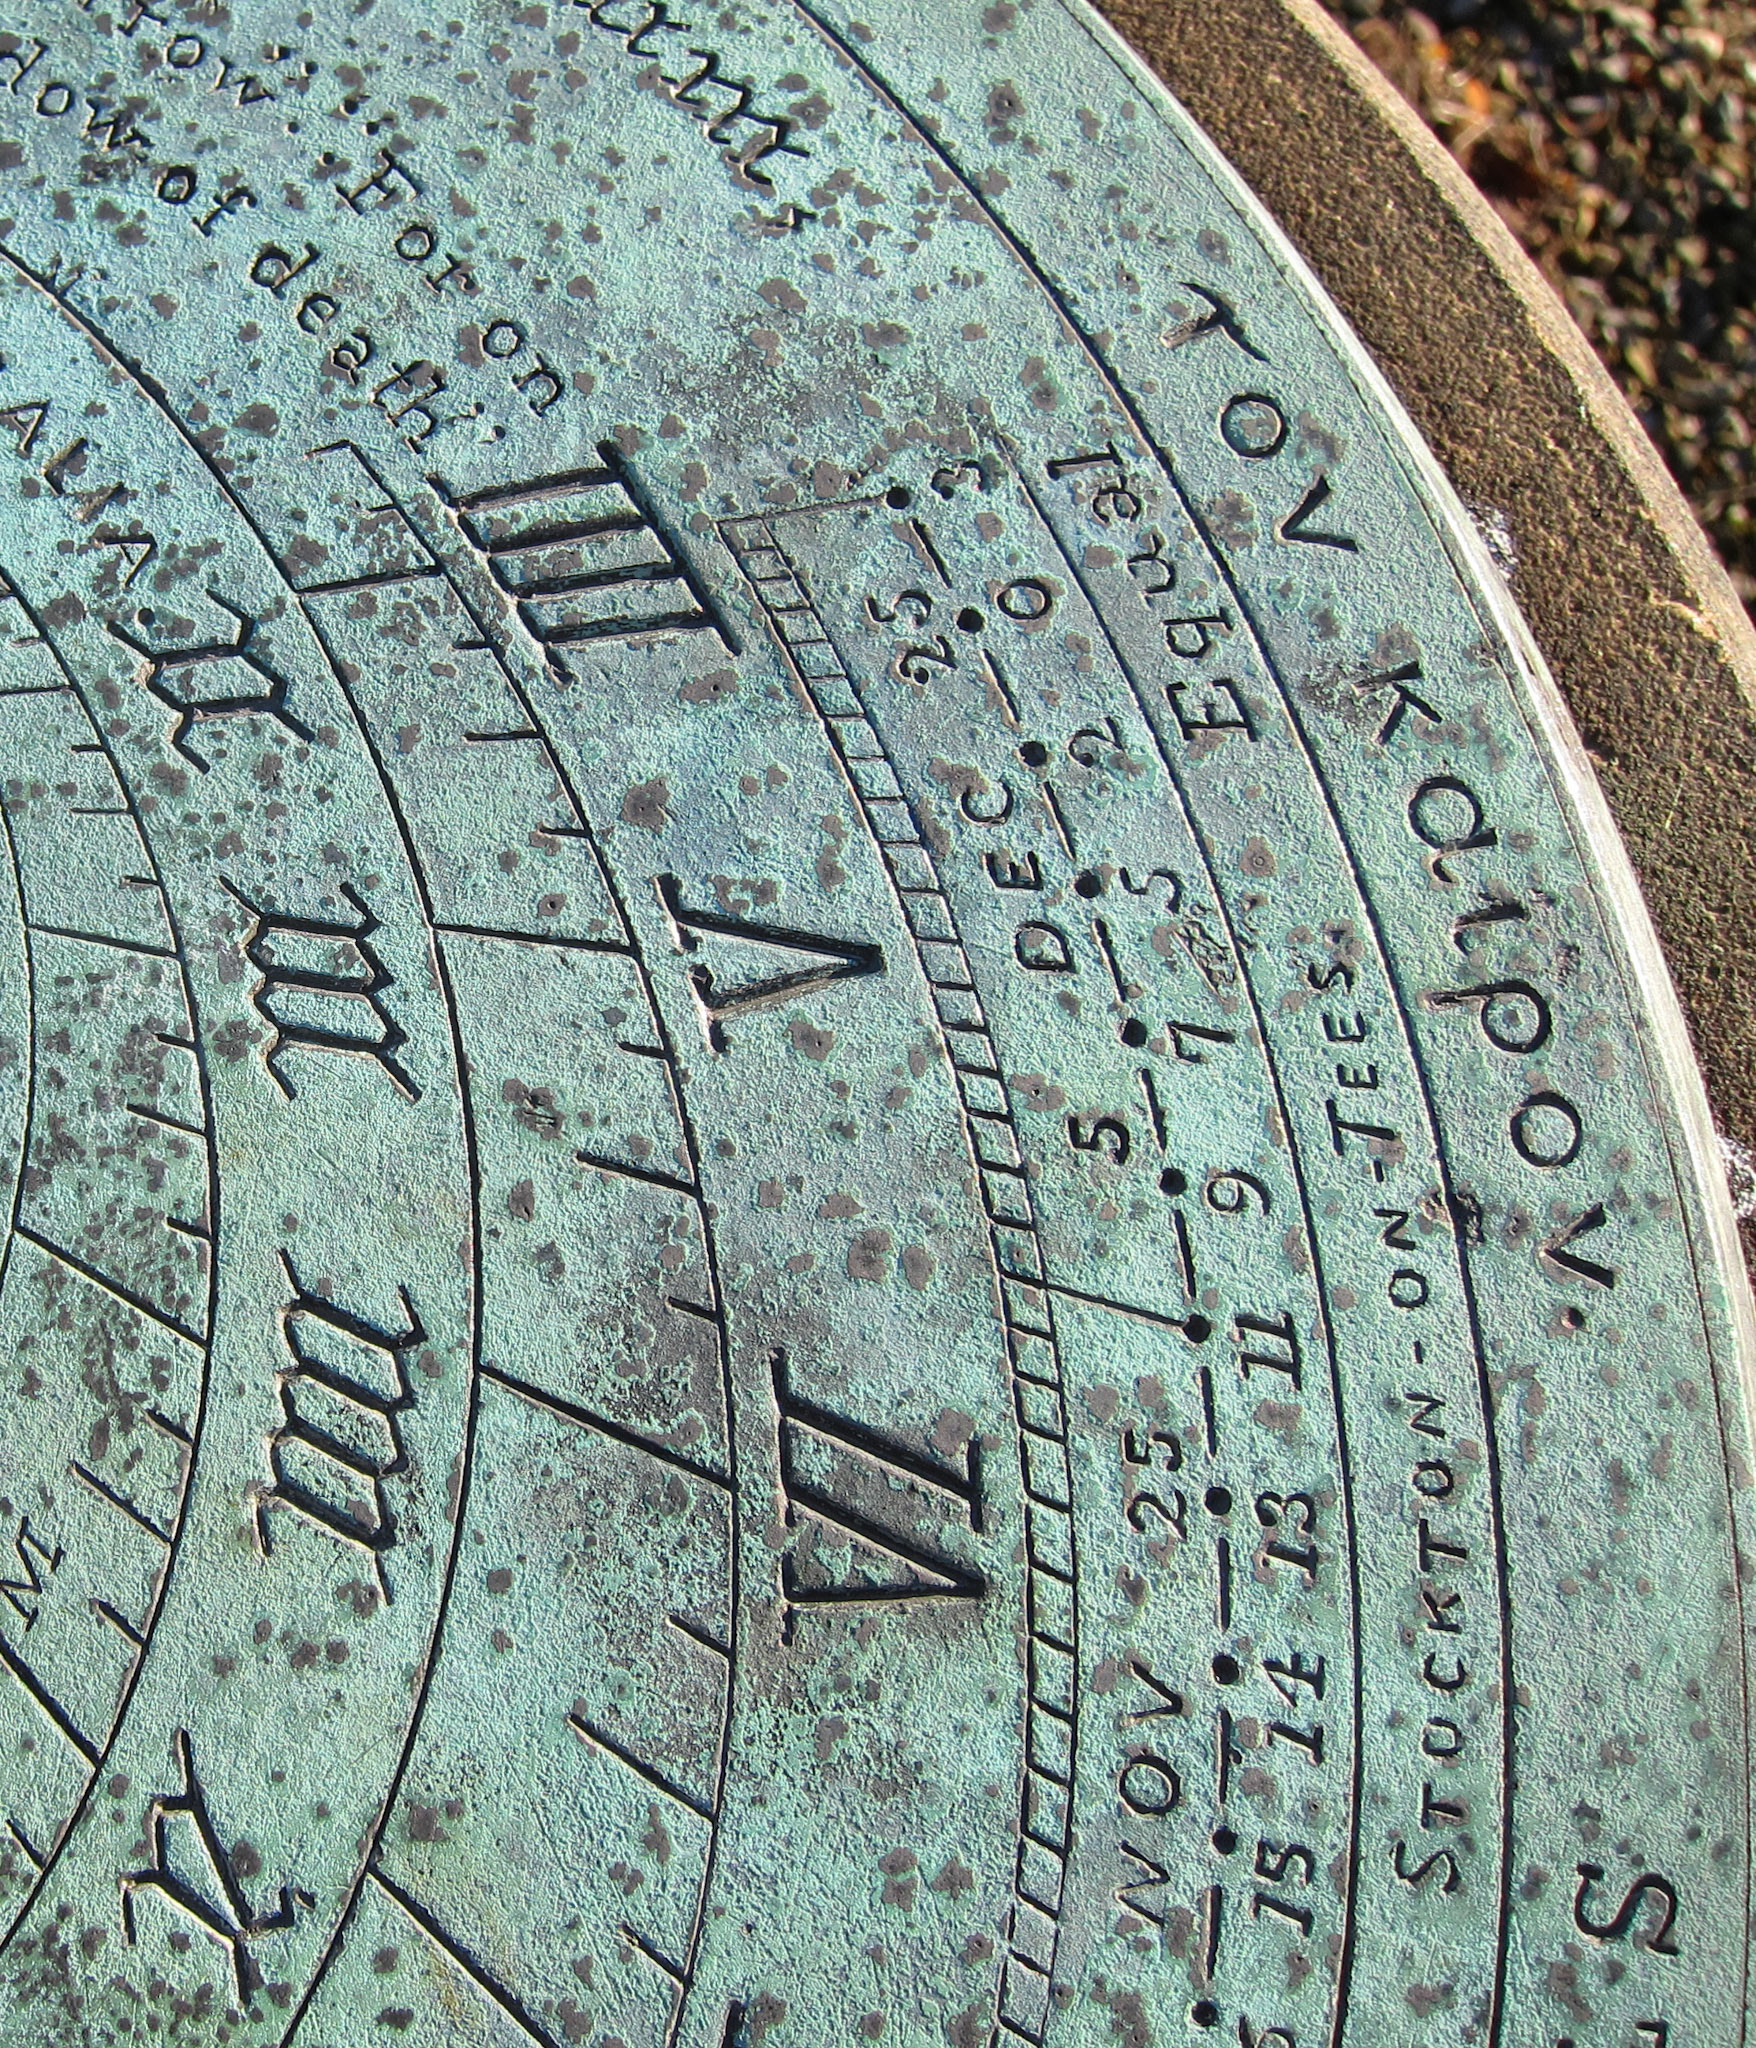
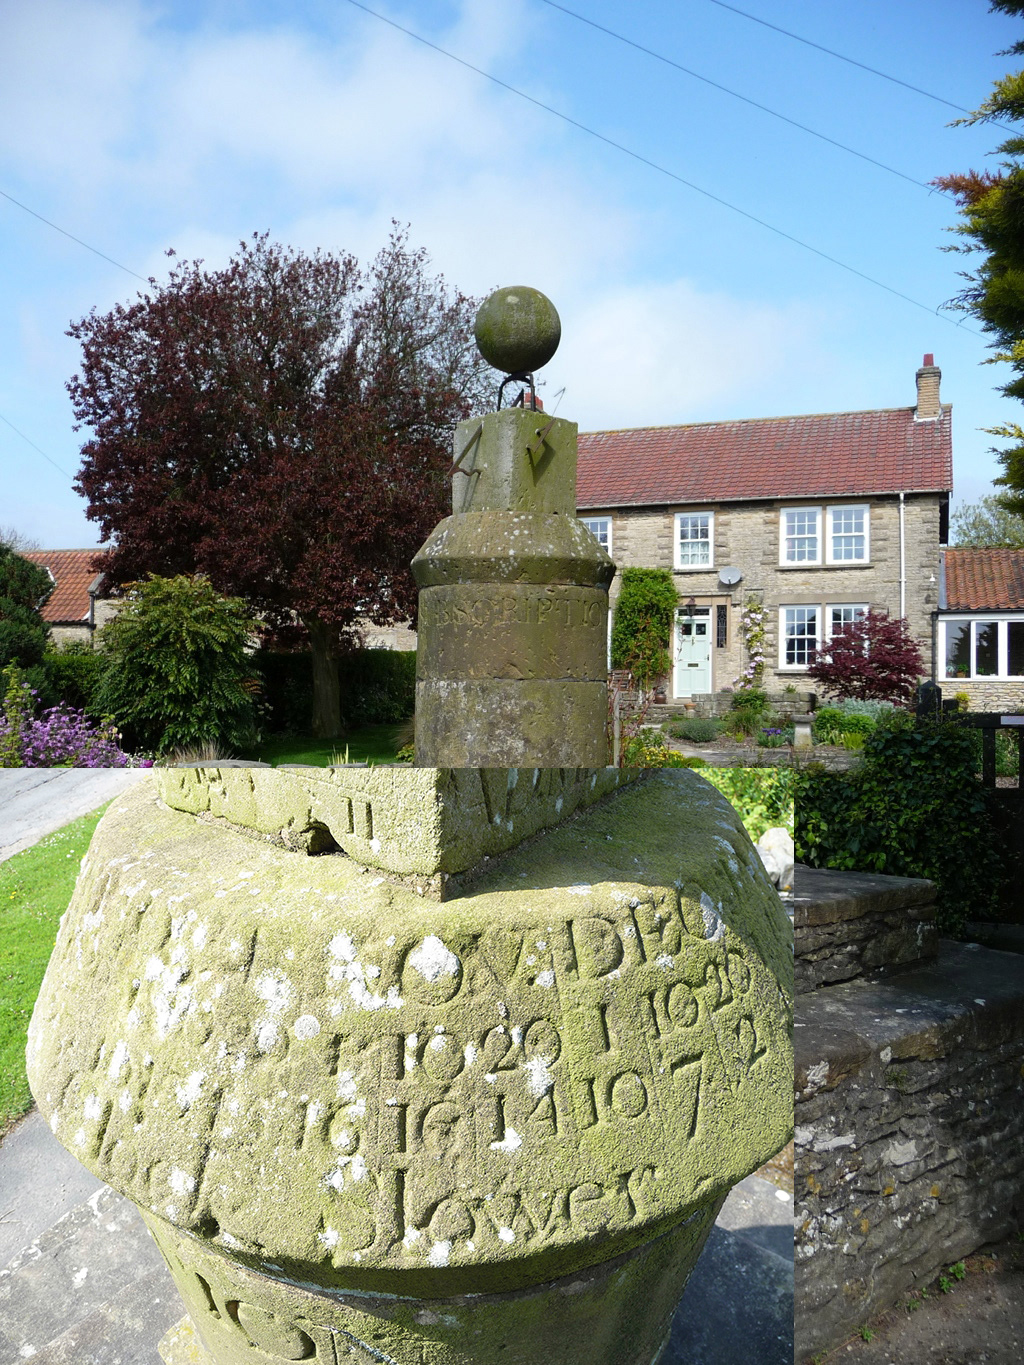
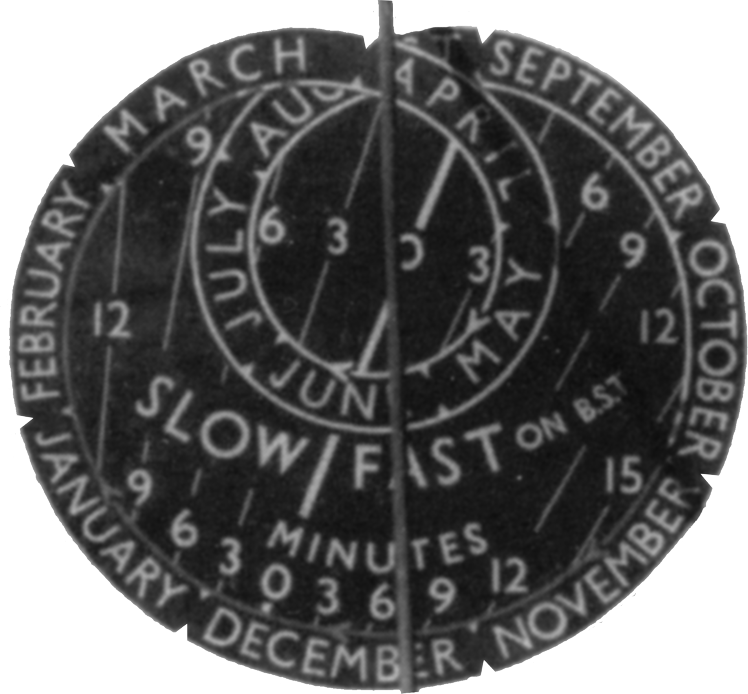
J.R. Miller - 1920 - Kirstenbosch, Cape Town : to read EoT, take the Hour number = the Month and read EoT on the periphery e.g for month 11 = November, EoT = -16 !
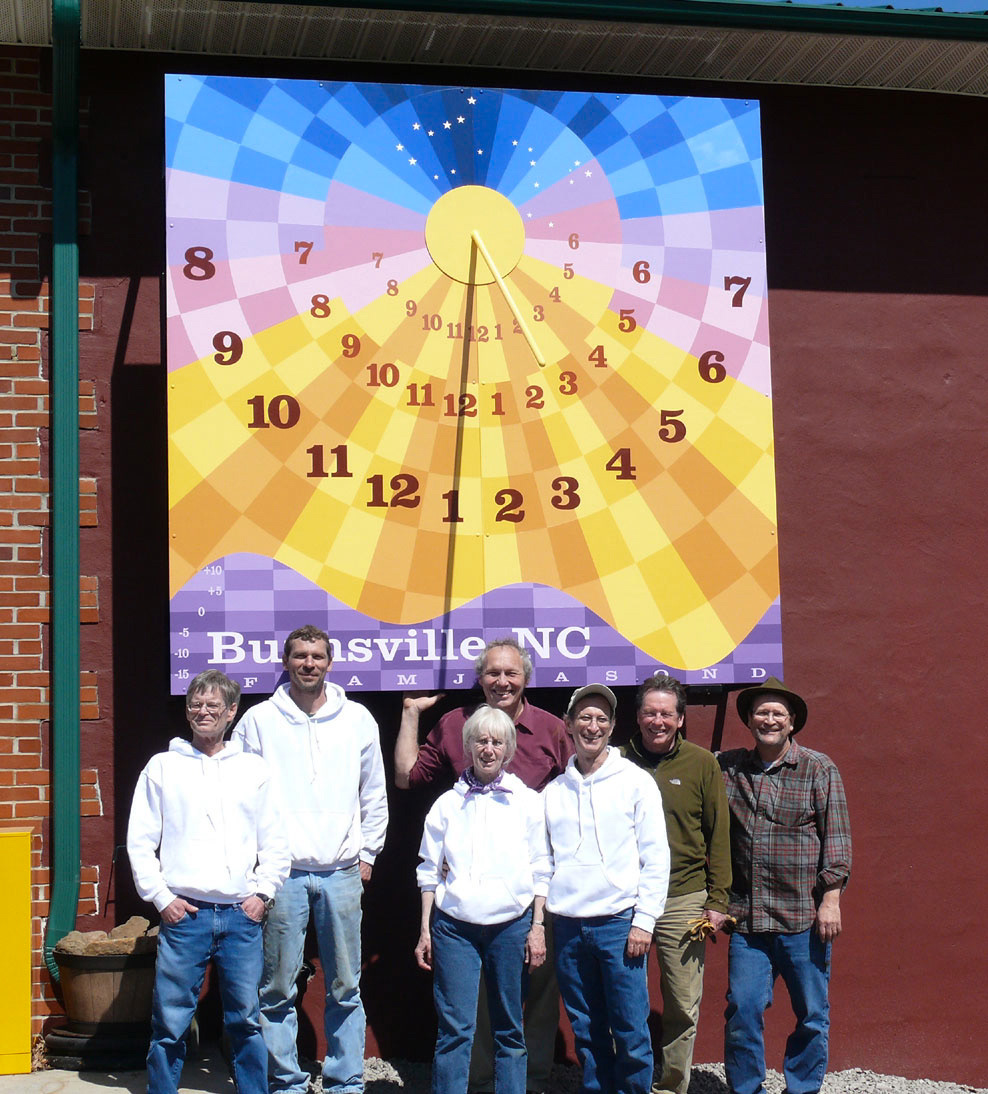
Burnsville Qullt Dial : the Appalachian mountains at the foot of the dial is the Equation of Time graph
Bromley House EoT chart
Rocky Mountain EoT by Steve Lelievre
Click on images to enlarge & view captions
HOW TO DRAW AN INTRINSIC REPRESENTATION OF THE EOT
There are many Intrinsic forms, but the one used here is the easiest. The dependent variable (EoT in this case) is plotted along x-axis. The independent variable (a constant time interval of 1 day in this case) is plotted along the curve itself (not along the y-axis as in a cartesian curve)..
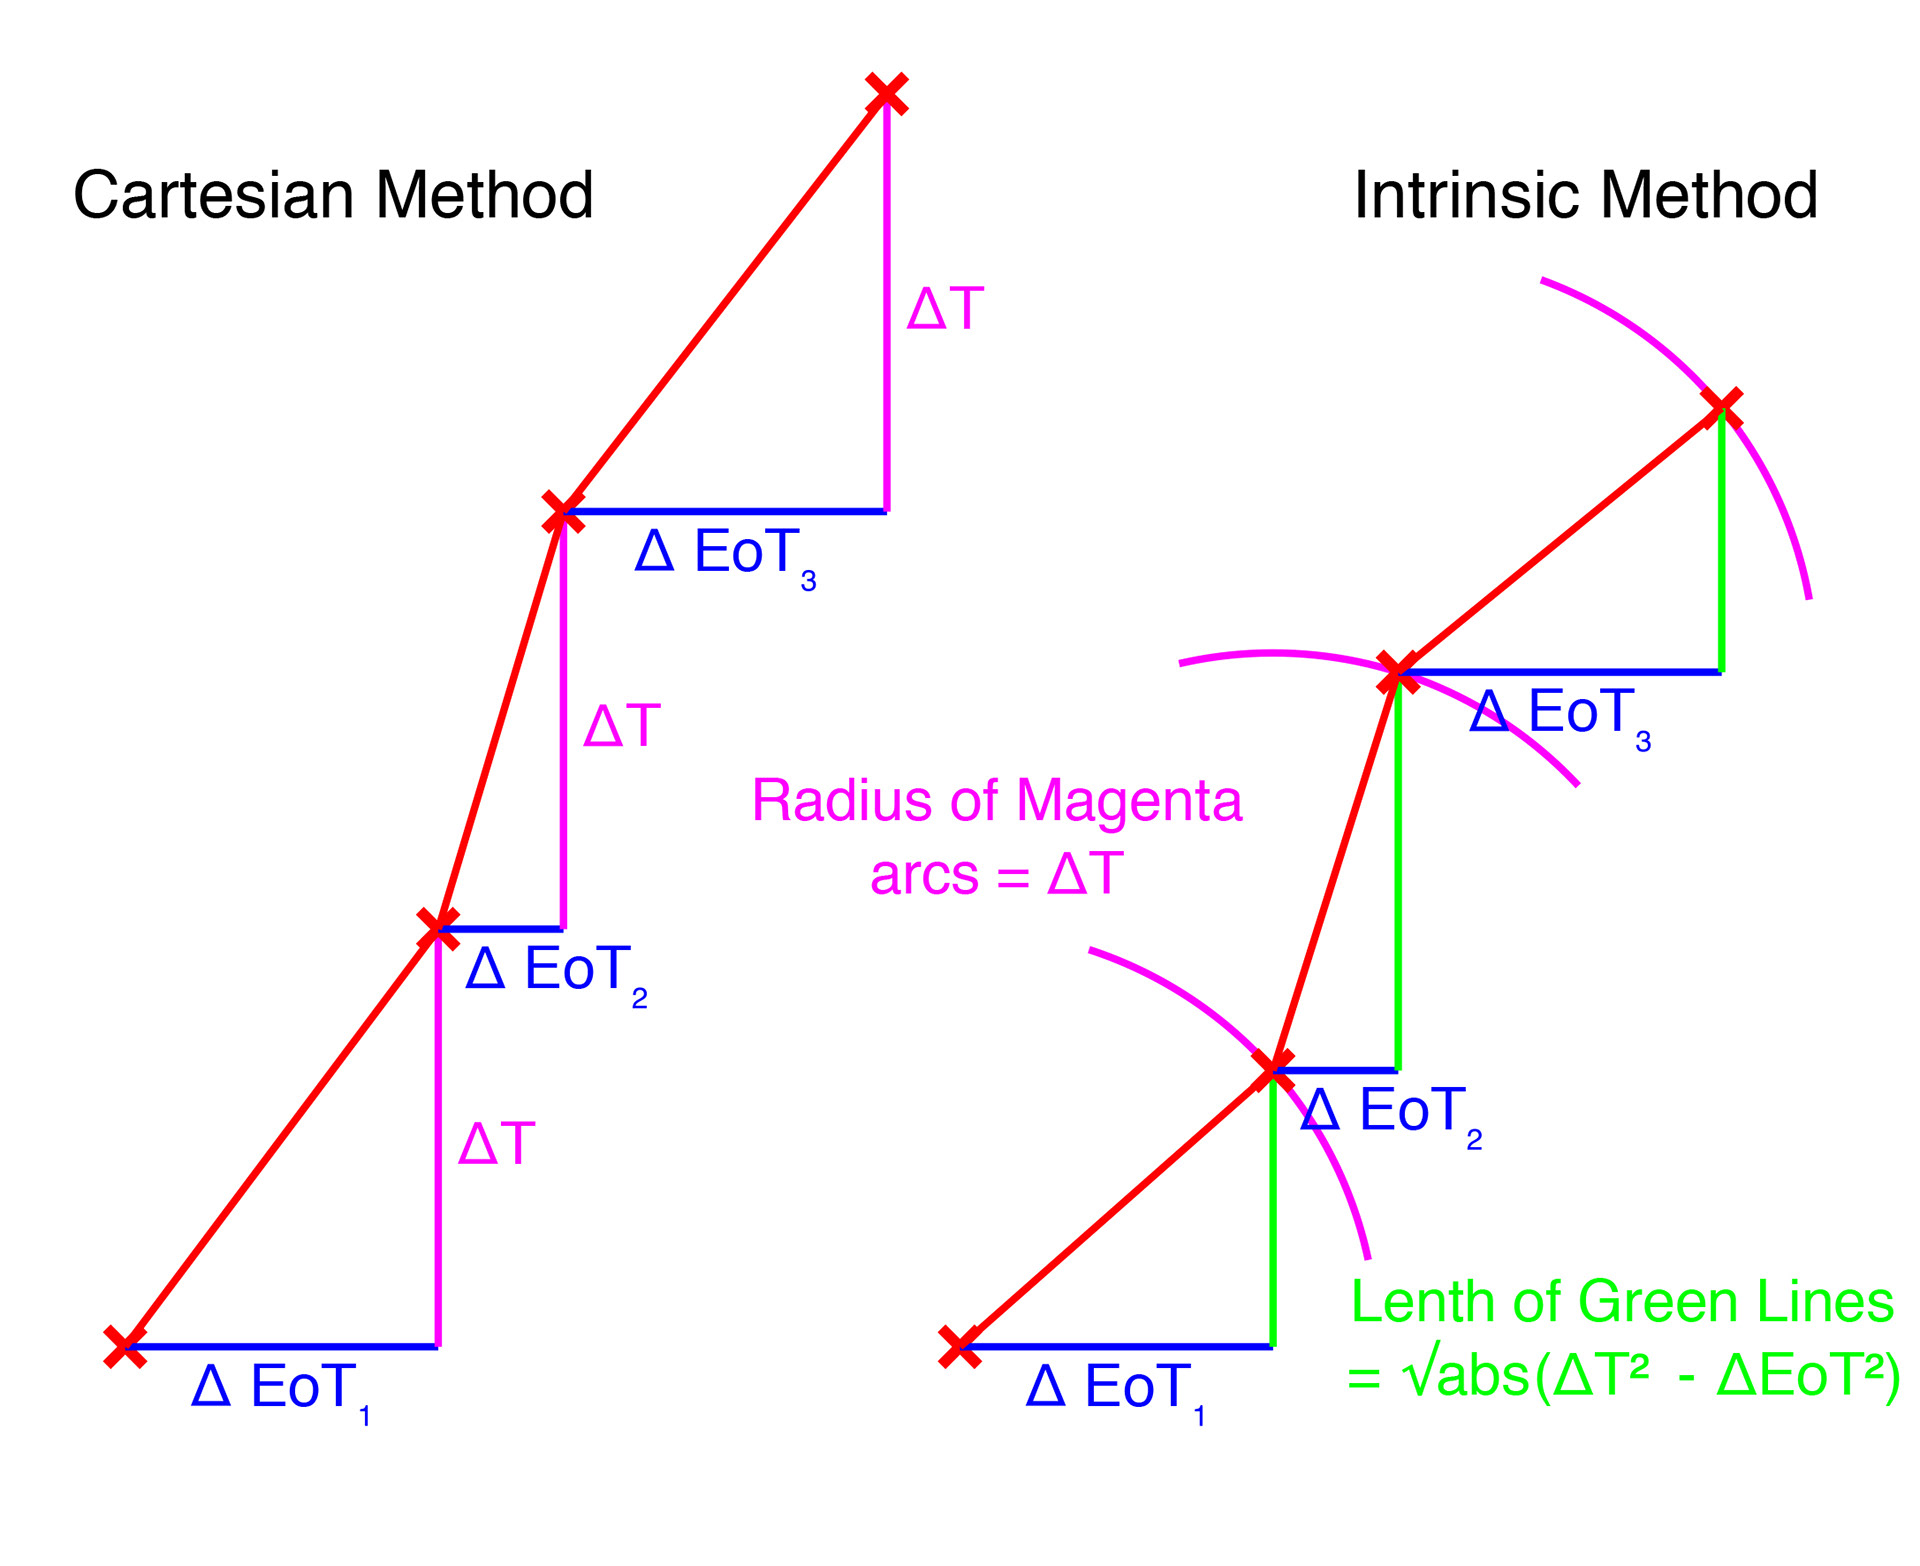
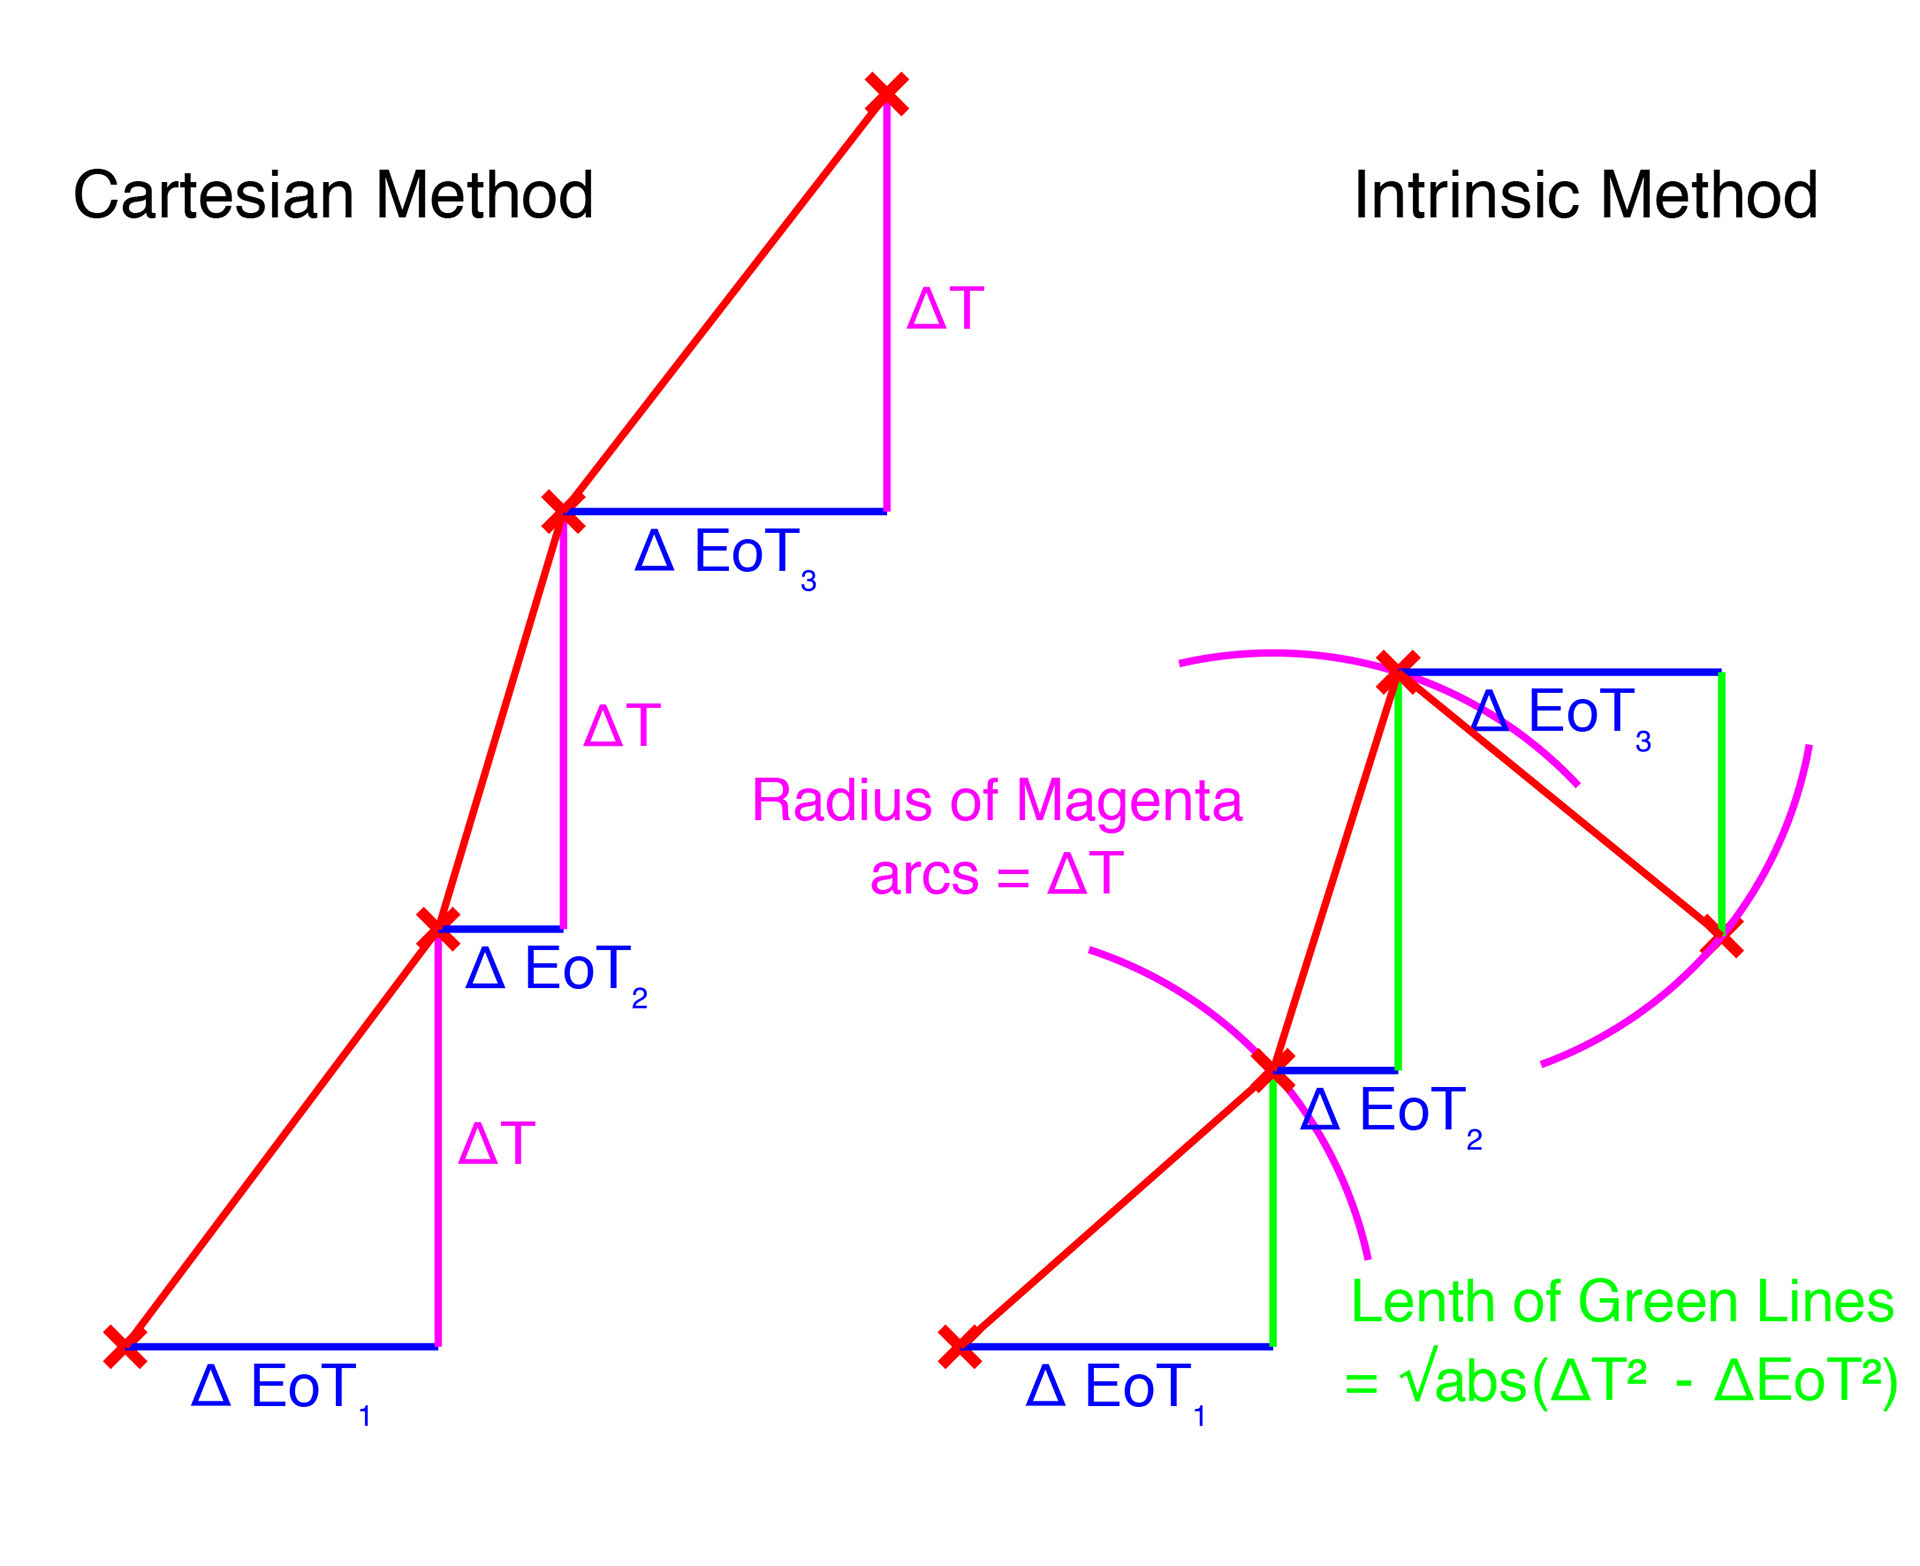
In the left figure above, both the Cartesian & Intrinsic methods are illustrated. The advantage of the Intrinsic method is shown on the right, the 2nd possible option for the last point is shown. This allows the curve to be folded at any point. This in turn can lead to a very compact representation of data, with no loss of information.
This compactness allows a fully readable, day-by-day representation of the equation of time to be placed on the face of a sundial, see below.
Fully marked up Flame graph
The flame graph etched onto a the Thruxton Old Rectory dial by the Author
Click on images to enlarge & view captions
INTRINSIC CURVES AND THE BURY ST EDMUNDS DIAL
Bury St Edmunds is a small market down in East Anglia in the UK. In the Abbey Gardens, there is a dial, with its Intrinsic EoT Curve This is of much cultural, scientific and horological interest. It is believed to be the first sundial to acknowledge National Mean Time - rather than Local Mean Time. It is greatly in need of conservation. The following YouTube video was made by the author for the Friends of the Abbey Gardens to help their fundraising. I do not think they ever deployed the video and I understand that restoration efforts have come to nought.
Further Information
For the historical background, republished by kind permission below are two papers by Dr John Davis:
1. © J. Davis: 'The Equation of Time on Sundials' BSS Bull., 16(iv), 135-144 (December 2003)
2. © J. Davis: 'More on The Equation of Time on Sundials' BSS Bull., 17(ii), 66-75 (June 2005)
The two papers are run together into a single document